MRR, Churn and LTV for First-Time Founders: Formulas and Worked Examples
Seven SaaS metrics, each with its formula, worked through for one invented company from MRR to LTV:CAC, plus the mistakes that make every number look better than it is.
 Roman Shalabanov
Published
10 min read

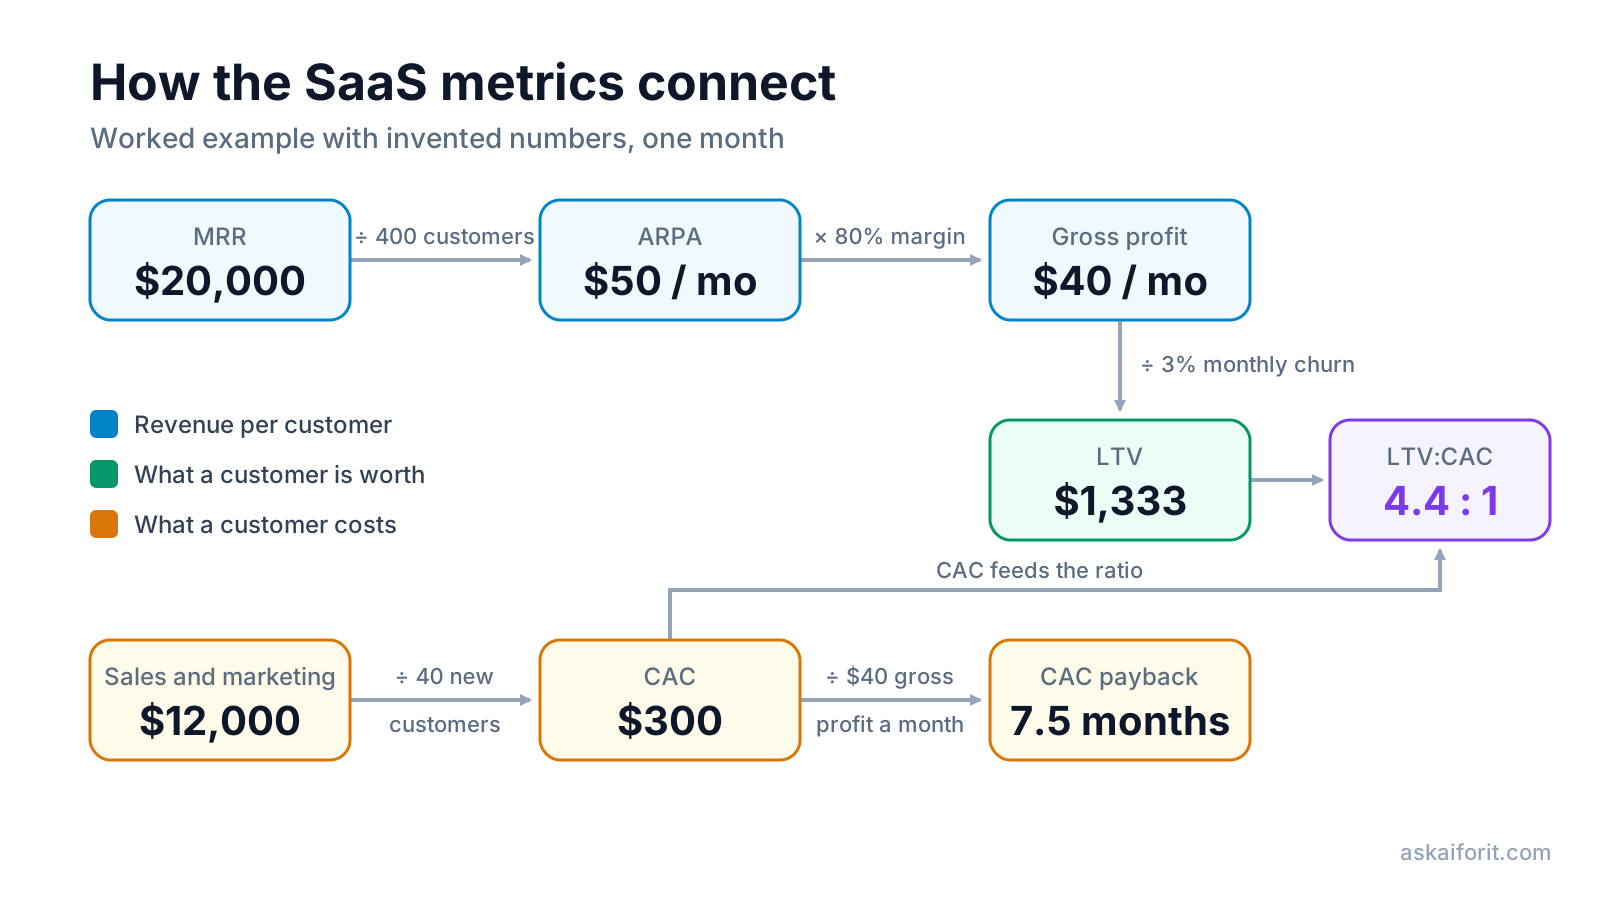
To calculate LTV for a SaaS, multiply average revenue per account (ARPA) by your gross margin and divide by monthly churn. A customer who pays $50 a month, at an 80% gross margin, in a business where 3% of customers cancel each month, is worth $50 × 0.8 ÷ 0.03 = $1,333 in gross profit. To get there you need two other numbers first: MRR, which gives you ARPA, and churn, which tells you how long customers stay.
This guide works through all of them with one invented company, so you can see how each number feeds the next: MRR and ARR, churn and net revenue retention, LTV, CAC and payback, LTV:CAC, the customers you need for an MRR goal, and the Rule of 40. Every figure is an example computed from the formula next to it. Each metric also has a free calculator that uses the same formulas and shows them with the result.
$22,200
MRR at the end of the month
3%
monthly customer churn
$1,333
LTV per customer
4.4:1
LTV:CAC
Source: Worked example with invented numbers, explained below
Calculate MRR and ARR from what customers pay
MRR (monthly recurring revenue) is the sum of what every paying customer is billed per month for their subscription. ARR (annual recurring revenue) is MRR × 12.
Four rules keep the input honest:
- Annual plans count monthly. Divide the yearly price by 12. A customer who pays $790 a year adds $65.83 to MRR every month, not $790 in the month they pay.
- Use the price after discounts. Count what the customer is actually billed.
- Leave out anything that does not recur. Trials, free plans, setup fees, services and usage charges you do not bill every month are revenue, but not recurring revenue.
- Use one currency. Convert everything at a fixed rate before you add it up.
Our example company starts the month with 400 paying customers and $20,000 of MRR, so its ARPA is $20,000 ÷ 400 = $50. Here is how its MRR moves in one month:
- Start of the month: $20,000.
- Add new MRR from 40 new customers on the $50 plan: $2,000.
- Add expansion MRR from upgrades: $1,000.
- Subtract contraction MRR from downgrades: $200.
- Subtract churned MRR from 12 customers who cancelled: $600.
- End of the month: $20,000 + $2,000 + $1,000 − $200 − $600 = $22,200.
Net new MRR is $2,200, 11% growth in a month. ARR at the end of the month is $22,200 × 12 = $266,400. That is a snapshot of the run rate, not a forecast of the next twelve months.
Watch the parts, not only the total. A common summary is the SaaS quick ratio: (new + expansion + reactivation) ÷ (contraction + churn). With no reactivations this month, it is ($2,000 + $1,000) ÷ ($200 + $600) = 3.75. A ratio of 4 is often quoted as a target; treat it as a rule of thumb. The MRR & ARR calculator does both the plan total and the monthly breakdown.
Measure churn by customers and by revenue
Churn comes in two versions, customer and revenue, and three more formulas build on them:
- Customer churn = customers who cancelled during the month ÷ customers at the start of the month.
- Gross revenue churn = (churned MRR + contraction MRR) ÷ MRR at the start of the month.
- Net revenue retention (NRR) = (starting MRR − churned MRR − contraction MRR + expansion MRR) ÷ starting MRR.
- Annual churn = 1 − (1 − monthly churn)^12.
- Average customer lifetime = 1 ÷ monthly churn.
In the example, customer churn is 12 ÷ 400 = 3.0% a month. Gross revenue churn is ($600 + $200) ÷ $20,000 = 4.0%. NRR is ($20,000 − $600 − $200 + $1,000) ÷ $20,000 = 101%. Over a year, 1 − 0.97^12 = 30.6% of customers leave, not 36%, because each month's churn applies to a smaller base. The average customer stays 1 ÷ 0.03 ≈ 33 months.
Customer churn counts accounts; revenue churn counts money. They can differ a lot, since losing ten small accounts hurts less than losing one large one. NRR above 100% means the customers you already had pay you more this month than last, even after cancellations.
Common mistakes:
- Counting new customers in the base. The 40 who joined this month were not there at the start. Dividing by 440 gives 2.7% and understates churn.
- Ignoring failed payments. Expired cards that never get updated are churn too. Track them separately so you can fix them with reminders.
- Measuring annual contracts monthly. Customers on yearly plans can only leave at renewal, so measure their churn per renewal.
- Trusting one month. With 400 customers, a single cancellation moves churn by 0.25 points. Average three to six months before you draw conclusions.
There is no single good churn rate. Products sold to individuals and small businesses usually churn faster than software bought on annual contracts by larger companies, so compare yourself with businesses that sell the way you do. The churn rate calculator gives customer churn, revenue churn and NRR from the same inputs.
Calculate LTV from gross margin, not revenue
LTV (customer lifetime value) = ARPA × gross margin ÷ monthly churn.
Gross margin is the share of revenue left after the cost of serving customers: hosting, third-party APIs and AI model usage, payment fees and support. Dividing by churn is the same as multiplying by the average lifetime of 1 ÷ churn months.
In the example, gross profit per customer is $50 × 80% = $40 a month, and LTV is $40 ÷ 0.03 = $1,333. With revenue instead of margin you would get $50 ÷ 0.03 = $1,667. The difference, about $333, is what it costs you to serve that customer over their lifetime.
For AI products the margin matters even more, because every request costs money. If model costs pull the example's gross margin down to 60%, LTV falls to $50 × 0.6 ÷ 0.03 = $1,000. A 20-point drop in margin removes a quarter of the customer's value.
Where the formula breaks down:
- Very low churn. At 0.5% a month the formula implies a lifetime of 200 months, almost 17 years. Many teams cap the lifetime at three to five years for planning.
- Zero churn. The formula divides by zero. Use a cautious estimate from similar products instead.
- Expansion. The formula assumes ARPA stays flat. If customers upgrade over time, it understates LTV.
- Time. It does not discount future money, so treat long lifetimes with caution.
Try your own numbers in the LTV calculator.
Work out CAC and how fast it pays back
CAC (customer acquisition cost) = sales and marketing spend in a period ÷ new customers won in that period.
CAC payback (months) = CAC ÷ (ARPA × gross margin).
The example company spent $12,000 on sales and marketing this month, counting ads, content, tools and the part of salaries spent on selling and marketing. It won 40 customers, so CAC is $12,000 ÷ 40 = $300. Each customer brings $40 of gross profit a month, so payback is $300 ÷ $40 = 7.5 months.
That assumes the customer stays. Some leave before they have paid back, so the average customer takes longer. The month when expected gross profit reaches CAC is ln(1 − CAC × churn ÷ monthly gross profit) ÷ ln(1 − churn). Here that is ln(1 − 300 × 0.03 ÷ 40) ÷ ln(0.97) ≈ 8.4 months. If CAC × churn is at least the monthly gross profit, the average customer never pays back at all.
A payback under 12 months is a commonly quoted rule of thumb for products sold to small businesses. Companies with large annual contracts often accept longer.
Common mistakes:
- Leaving out salaries. Ads are only part of acquisition cost.
- Leaving out your own time. Early on, founders do most of the selling. If you count your hours at zero, CAC looks far lower than it will be once you hire.
- Blending channels. Customers from search and word of mouth cost little, so a blended CAC can hide an expensive paid channel. Calculate it per channel when you can.
- Ignoring the delay. Spend this month often brings customers next month. Compare spend and new customers over a quarter.
The CAC payback calculator shows both the simple and the churn-adjusted payback.
Compare LTV with CAC
LTV:CAC = LTV ÷ CAC. In the example, $1,333 ÷ $300 = 4.4:1: each customer is expected to return about 4.4 times what it cost to win them, in gross profit.
Reading LTV:CAC (commonly cited rules of thumb)
| Ratio | What it usually suggests |
|---|---|
| Below 1:1 | You lose money on every customer you win |
| 1:1 to 3:1 | Customers pay back, but leave little for the rest of the business |
| 3:1 to 5:1 | The range most often called healthy |
| Above 5:1 | You may be underspending on growth |
The often-quoted 3:1 target is a guideline from venture-backed SaaS. One widely cited source is investor David Skok's SaaS Metrics 2.0. It puts the best SaaS businesses above 3:1 and warns when CAC takes more than 12 months to recover.
A bootstrapped product with low costs can be healthy below 3:1. The ratio also ignores time, so read it together with payback: 5:1 is less comfortable if it takes three years to earn the acquisition cost back. Check yours with the LTV:CAC ratio calculator.
Find out how many customers you need for an MRR goal
Customers needed = MRR goal ÷ ARPA, rounded up. For a goal of $30,000 MRR at $50, that is 600 customers. The example company ended the month with 400 + 40 − 12 = 428.
A straight line says 172 more customers at 40 a month takes 4.3 months. Churn makes it slower, because it grows with the base. Each month:
customers next month = customers this month × (1 − monthly churn) + new customers per month
At 3% churn the company passes 600 customers in about 7 months. At 6% churn it takes about 21 months, and to hit the same 7-month date it would need about 55 new customers a month instead of 40. Churn also sets a ceiling: the base levels off at new customers per month ÷ churn, which is about 1,333 customers at 3% and 667 at 6%.
Source: Worked example: 428 customers at the start, 40 new each month
Show data
| Month | 3% monthly churn | 6% monthly churn |
|---|---|---|
| 0 | 428 | 428 |
| 3 | 507 | 468 |
| 6 | 579 | 502 |
| 9 | 645 | 530 |
| 12 | 705 | 553 |
| 15 | 760 | 572 |
| 18 | 810 | 588 |
| 21 | 856 | 602 |
| 24 | 897 | 613 |
Most products win free users or trial sign-ups first. Divide the paying customers you need by your trial-to-paid conversion rate: at 4%, 40 paying customers a month means 1,000 sign-ups. The customers to MRR goal calculator runs the month-by-month path for your own numbers.
Know what the Rule of 40 measures and when it applies
Rule of 40 score = revenue growth rate (%) + profit margin (%). A score of 40 or more meets the rule. Growth is usually year-over-year revenue or ARR growth; the margin is usually EBITDA or free cash flow margin. Pick one and keep it.
Take a larger invented company with $2,600,000 of revenue in the last 12 months and $2,000,000 in the 12 months before. Growth is ($2,600,000 − $2,000,000) ÷ $2,000,000 = 30%. With a 12% profit margin, the score is 30 + 12 = 42, so it meets the rule.
For a first-time founder the rule can wait. Growth from a small base swings wildly, so a score built on 200% growth and a −150% margin says little. Investors mostly apply it once revenue is steady. Brad Feld, whose 2015 post popularized the rule, wrote it for SaaS companies at scale, around $50 million in revenue.
Until then, MRR growth, churn and payback tell you more. The Rule of 40 calculator is there when you get to that stage.
Avoid the mistakes that make every metric look better
The metrics form a chain, so one weak input spoils several results. If churn is understated, LTV, LTV:CAC and the time to your revenue goal all look better than they are. Check these before you share any number:
- Mixing periods. Monthly ARPA with annual churn is off by a factor of 12. Keep everything monthly.
- Revenue instead of gross margin. It inflates LTV, LTV:CAC and makes payback look shorter.
- Counting trials and free users as customers. Count a customer from their first paid billing period.
- Booking annual payments in one month. It inflates MRR in renewal months and then drops.
- Trusting a few months of data. Before you have a few hundred customers, treat every metric as a range and watch the direction.
- Using different margins in different metrics. If you subtract hosting, model and payment costs to get gross margin for LTV, subtract the same costs for payback.
Subscription analytics tools such as ChartMogul calculate these metrics from your billing data. Check that their definitions match yours, for example how they count trials, discounts and reactivations. These tools track the numbers for you:
Subscription analytics and CRM solution for business growth.
Streamlined payment and subscription management for digital businesses.
FAQ
How do I calculate LTV for a SaaS?
Multiply average revenue per account by gross margin and divide by monthly churn. At $50 a month, an 80% margin and 3% monthly churn, LTV is $50 × 0.8 ÷ 0.03 = $1,333.
Should LTV use revenue or gross margin?
Gross margin. CAC is paid from gross profit, so a revenue-based LTV overstates what a customer contributes. For AI products with large model costs, the gap can be big.
How do I convert annual churn to monthly churn?
Monthly churn = 1 − (1 − annual churn)^(1/12). An annual churn of 30% is about 2.9% a month. Going the other way, 3% a month is 30.6% a year.
What is a good churn rate for an early-stage SaaS?
There is no single number. Compare yourself with companies that have similar customers and contracts, and focus on whether your own rate goes down month after month.
When do LTV and CAC become reliable?
Once you have a few hundred customers, several months of churn history and a steady acquisition channel. Before that, recalculate monthly and read the results as ranges.