LTV Calculator
Estimate what a customer is worth over their lifetime with your margin and churn.
Runs in your browser. Nothing is uploaded.
MRR divided by paying customers.
Revenue minus hosting, third-party APIs, payment fees and support, as a share of revenue.
If you track churn per year: 30% a year is about 2.9% a month.
Customer lifetime value (gross profit)
Revenue over the lifetime:
Enter revenue per account, a gross margin between 1 and 100%, and a churn rate above 0. With zero churn the formula has no upper limit.
Formula
LTV = ARPA × gross margin ÷ monthly churn. Lifetime = 1 ÷ monthly churn.
Expected gross profit per customer over time
Each month adds less, because some customers have left. The curve approaches LTV.
Related: LTV:CAC Ratio Calculator, CAC & Payback Period Calculator
Embed this calculator
Paste this code into your site. The calculator stays free and up to date.
The formula
LTV = ARPA × gross margin ÷ monthly churn
- ARPA is average revenue per account per month: MRR divided by paying customers.
- Gross margin is the share of revenue left after the cost of serving customers: hosting, third-party APIs and AI model usage, payment fees and support.
- Monthly churn is the share of customers who cancel each month.
Dividing by churn is the same as multiplying by the average lifetime, because a customer stays 1 ÷ churn months on average.
Worked example
| Input | Value |
|---|---|
| ARPA | $50 a month |
| Gross margin | 80% |
| Monthly churn | 3% |
- Gross profit per customer per month: $50 × 80% = $40.
- Average lifetime: 1 ÷ 3% ≈ 33 months.
- LTV: $40 ÷ 3% = $1,333.
Without the margin, revenue over the lifetime would be $50 ÷ 3% = $1,667. The difference is what it costs you to serve that customer.
How to read it
LTV is an average expectation, not a promise from any single customer. Some will leave in the first month, a few will stay for years. The chart shows how the expected gross profit adds up: early months contribute the most, because more of the starting customers are still around, and the curve flattens as it approaches the LTV line.
On its own LTV says little. Its job is to set a ceiling on what you can spend to win a customer, so compare it with your acquisition cost in the LTV:CAC ratio calculator and check how fast that cost comes back with the CAC payback calculator.
Common mistakes
- Using revenue instead of gross margin. It overstates LTV by the cost of serving customers. For AI products with heavy model costs the gap can be large.
- Trusting churn from a young customer base. In the first months churn is noisy, and very low churn produces an absurd LTV. At 0.5% a month the formula implies a lifetime of 200 months, almost 17 years. Many teams cap the lifetime at three to five years for planning.
- Ignoring expansion. The simple formula assumes ARPA stays flat. If customers upgrade over time, it understates LTV; if NRR is above 100%, the formula no longer describes the business well.
- Mixing periods. Use monthly ARPA with monthly churn, or annual with annual. Mixing them is off by a factor of 12.
Why does the calculator use gross margin?
Because LTV should measure what a customer contributes, not what they pay. Gross profit is the money left to cover acquisition, product development and other costs.
What if my churn is zero?
Then the formula divides by zero and LTV has no limit. Use a conservative churn estimate from similar products, or cap the lifetime at a fixed number of months.
How do I get monthly churn from annual churn?
Monthly churn = 1 − (1 − annual churn)^(1/12). An annual churn of 30% is about 2.9% a month.
Does LTV include expansion revenue?
Not in this simple version. If upgrades are common, use the average revenue per account after a typical customer has been with you for a while, or model cohorts in a spreadsheet.
How accurate is LTV for a new startup?
It is a rough estimate until you have enough customers and history to measure churn reliably. Recalculate it every month and look at the trend.
Finance tools from our directory
Browse: Finance, Business, Analytics
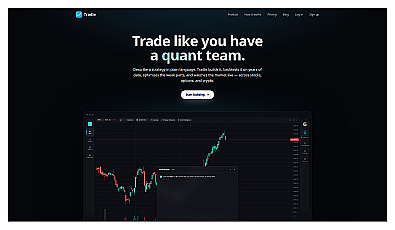
AI-driven platform for trading research and strategy validation.
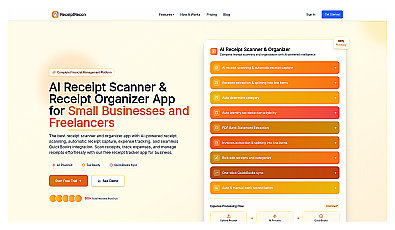
AI-powered scanner and organizer for receipts and expenses.
Advanced consumer data analysis for smarter marketing decisions.



Discover your ideal audience with targeted marketing strategies.