Graphy app
Create clear visuals from complex data effortlessly.
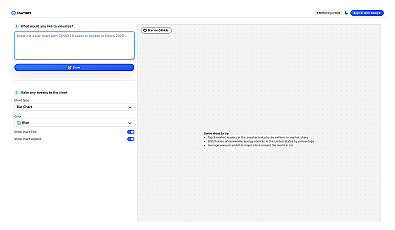
Create professional line charts to visualize data trends easily.
Line Graph Maker allows users to create line graphs that show trends and changes over…
Read more
Create clear visuals from complex data effortlessly.

Create engaging and interactive charts for data visualization.
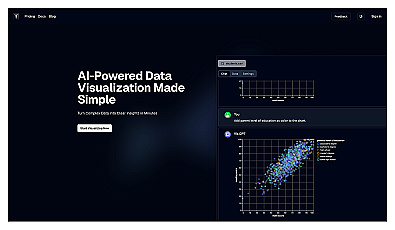
Transform complex data into clear visual insights effortlessly.
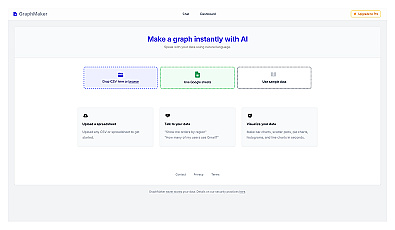
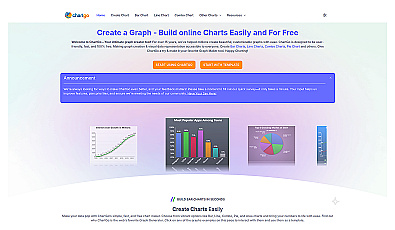
Create various types of charts from data effortlessly.

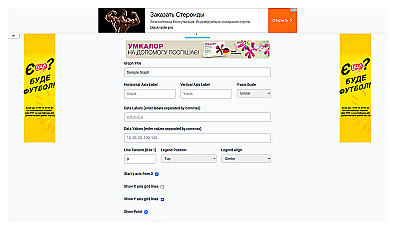
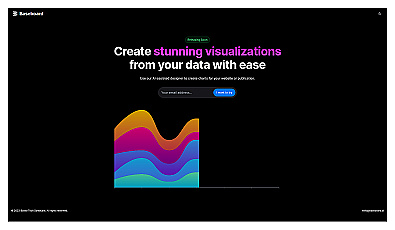
Create stunning charts from data with ease and speed.

Create stunning graphs from raw data effortlessly.

Visualize data to uncover insights and support decision-making.

Automated data visualization generator for clear infographics.

Create engaging visual reports and dashboards with ease.
Transform complex data into clear and engaging visuals.

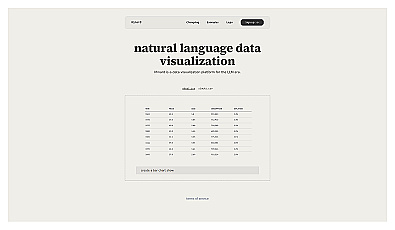
Transform data into visual charts using natural language commands.
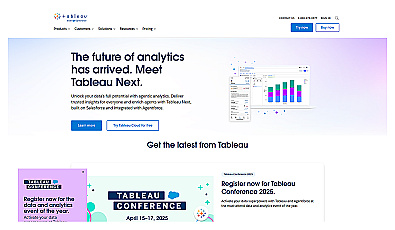
Visual data representation for informed decision-making.

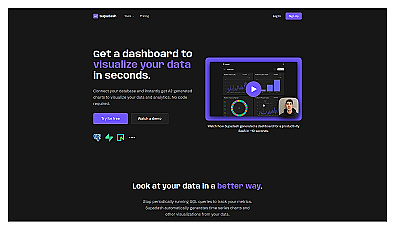
AI-driven data visualization and SQL query automation.
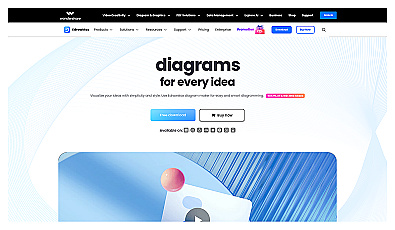
Create stunning diagrams with an intuitive visual design tool.

Visualize and analyze data from multiple sources seamlessly.
Create various customizable charts for visual data representation.

Interactive data visualization components for clear insights.

Natural language data visualization for better insights.
Visualize data trends with automatic chart generation.
Visualize data insights through intuitive and clear graphics.

Interactive charts and maps for data visualization.
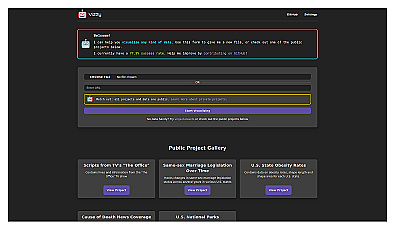
Visualize data effortlessly with natural language insights.

Create engaging charts effortlessly from your data.