
ChartyAI
Create stunning charts from data with ease and speed.
Create engaging and interactive charts for data visualization.
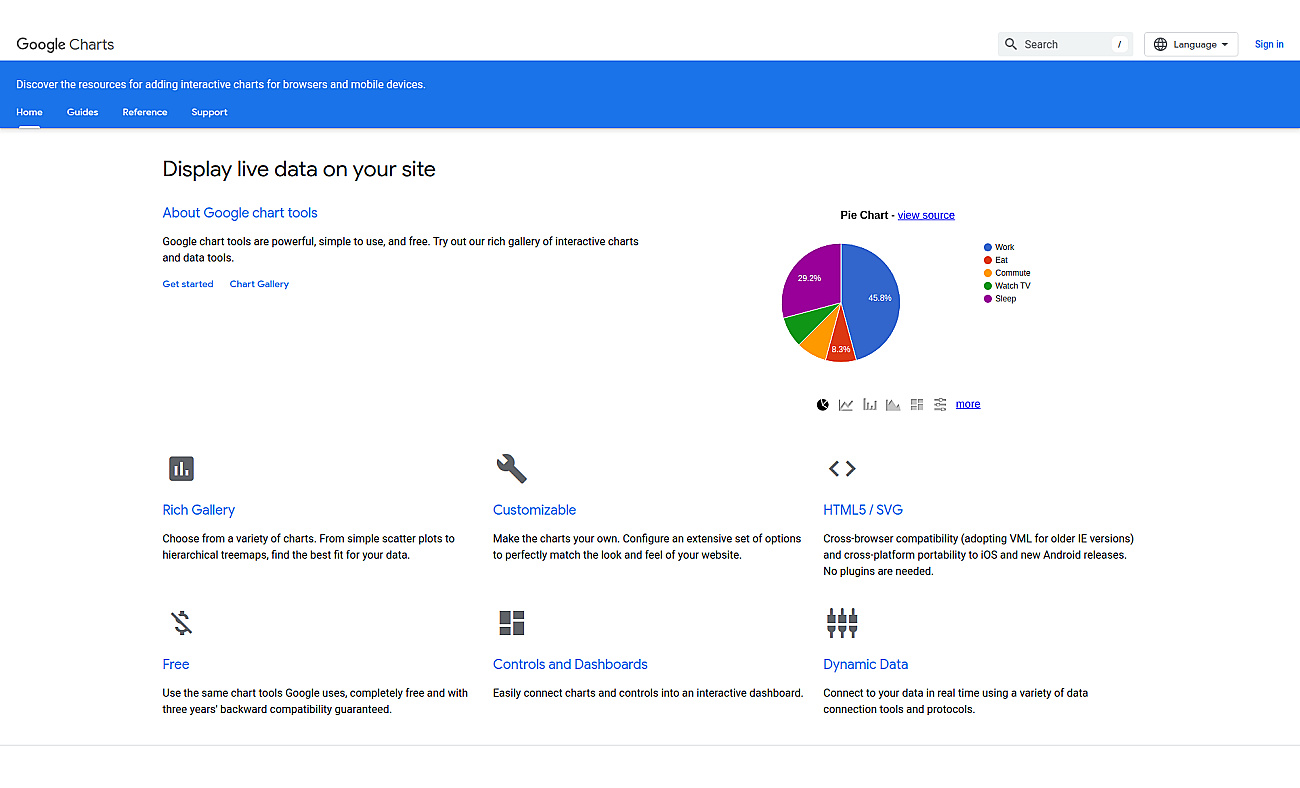
Google Charts creates interactive charts and graphs to visualize data effectively. This resource allows users to turn raw data into understandable visuals, making communication clearer.
It offers various chart types and customization options, catering to both personal and business needs. Web developers find it particularly useful for enhancing user experiences with dynamic data displays. Google Charts is free, ensuring accessibility for different projects.
Users can visualize everything from sales performance to educational materials, making information engaging and easy to interpret.
Based on overlapping tasks and related categories.
Create stunning charts from data with ease and speed.

Visualize data to uncover insights and support decision-making.

Transform data into visual charts using natural language commands.

Visualize and analyze data from multiple sources seamlessly.

Automated data visualization generator for clear infographics.

AI-driven data visualization and SQL query automation.
Discover other similar tools and compare features