
ChartyAI
Create stunning charts from data with ease and speed.
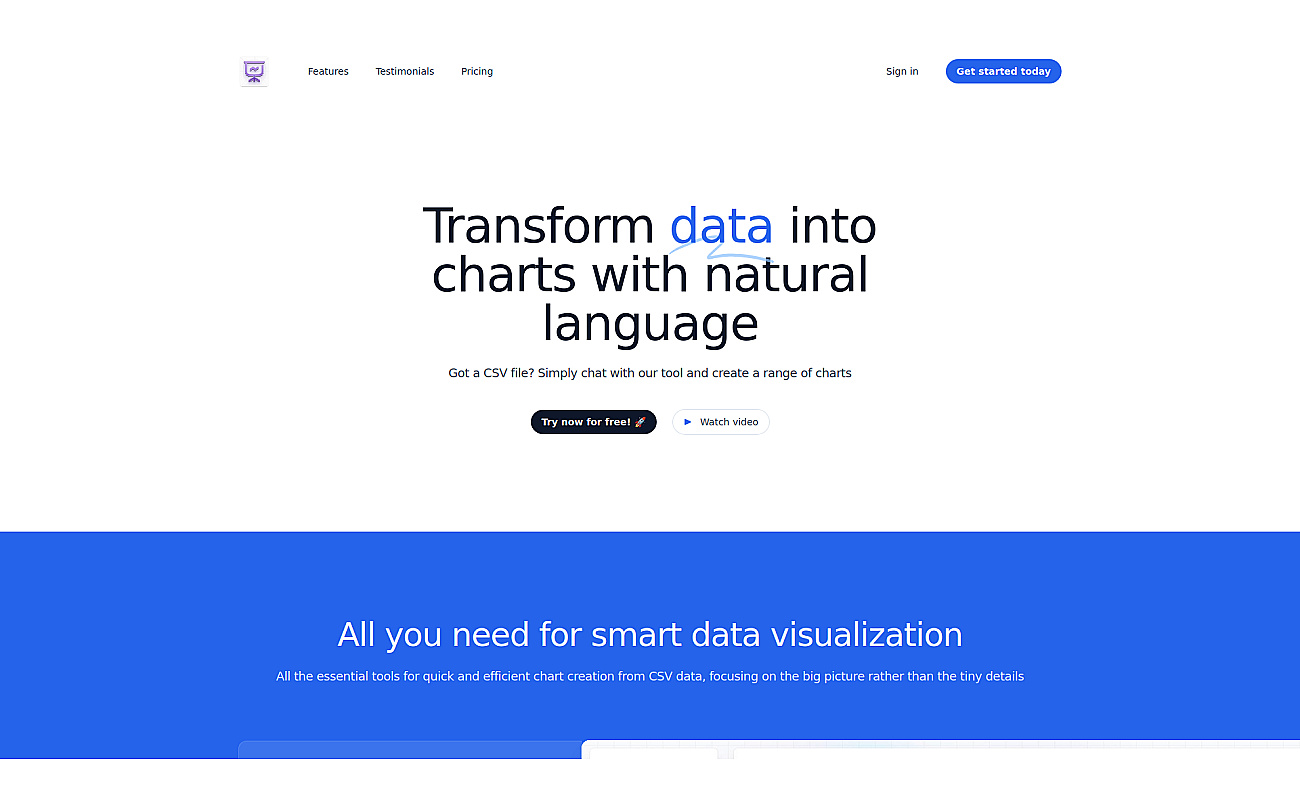
Transform data into visual charts using natural language commands.
Chat2CSV is a data visualization service that lets users create charts through simple, conversational commands. Instead of needing coding skills, anyone can type requests like 'show sales by region' to generate visuals.
This makes understanding data straightforward and less intimidating. The service supports various chart types, ensuring there’s always an appropriate way to present information. By focusing on user privacy, it processes only essential metadata, keeping the main data secure.
Whether for presentations, tracking performance, or reporting insights, Chat2CSV aims to simplify the way individuals and businesses interpret their data, turning complex analysis into a clear visual format.
Based on overlapping tasks and related categories.
Create stunning charts from data with ease and speed.

Automated data visualization generator for clear infographics.

Create engaging and interactive charts for data visualization.

AI-driven data visualization and SQL query automation.

Natural language data visualization for better insights.

Visualize data to uncover insights and support decision-making.
Discover other similar tools and compare features