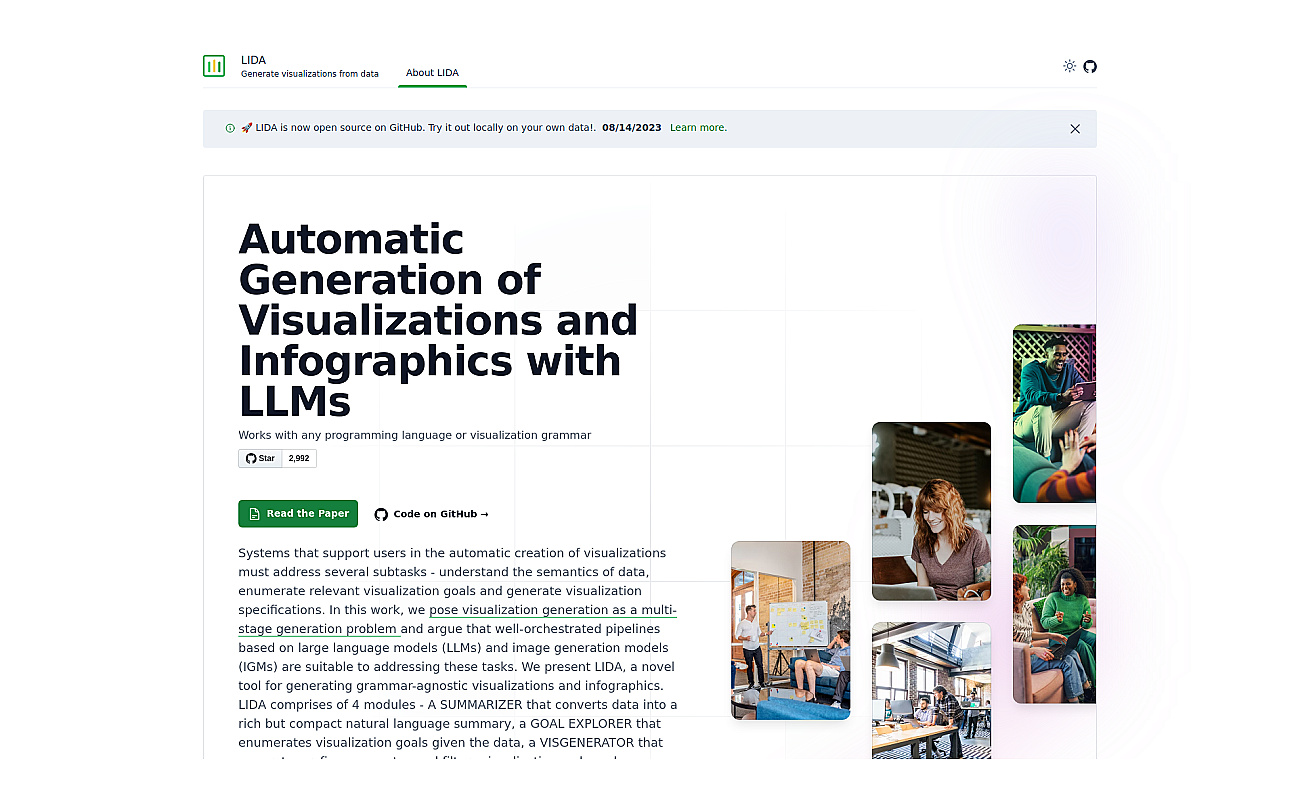
LIDA provides a way to create visual representations of data without needing advanced technical skills. This product allows users to generate infographics and charts easily, making it suitable for reports, presentations, or personal projects.
It supports various programming languages, which adds to its versatility for different users.
By using advanced language models, LIDA simplifies the visualization process, helping individuals summarize their data and clarify their goals. Users can explore different visualization options and receive explanations for their choices, enhancing their understanding of the data. This approach makes data more accessible and engaging, whether for educational purposes or marketing efforts.