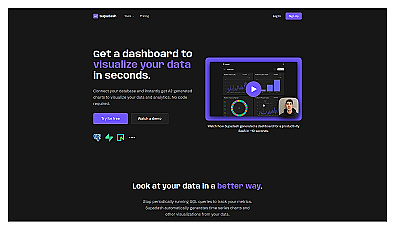
Supadash
Visualize data trends with automatic chart generation.
Create stunning charts from data with ease and speed.
Create stunning graphs from raw data effortlessly.
Visualize data insights through natural language queries.
Transform complex data into clear and engaging visuals.
Analyze data quickly without needing technical skills.
Streamlines data visualization and reporting in Google Sheets.
A user-friendly interface for querying databases seamlessly.
Transforms simple descriptions into complex Excel formulas and scripts.