
LIDA
Automated data visualization generator for clear infographics.
Visualize data trends with automatic chart generation.
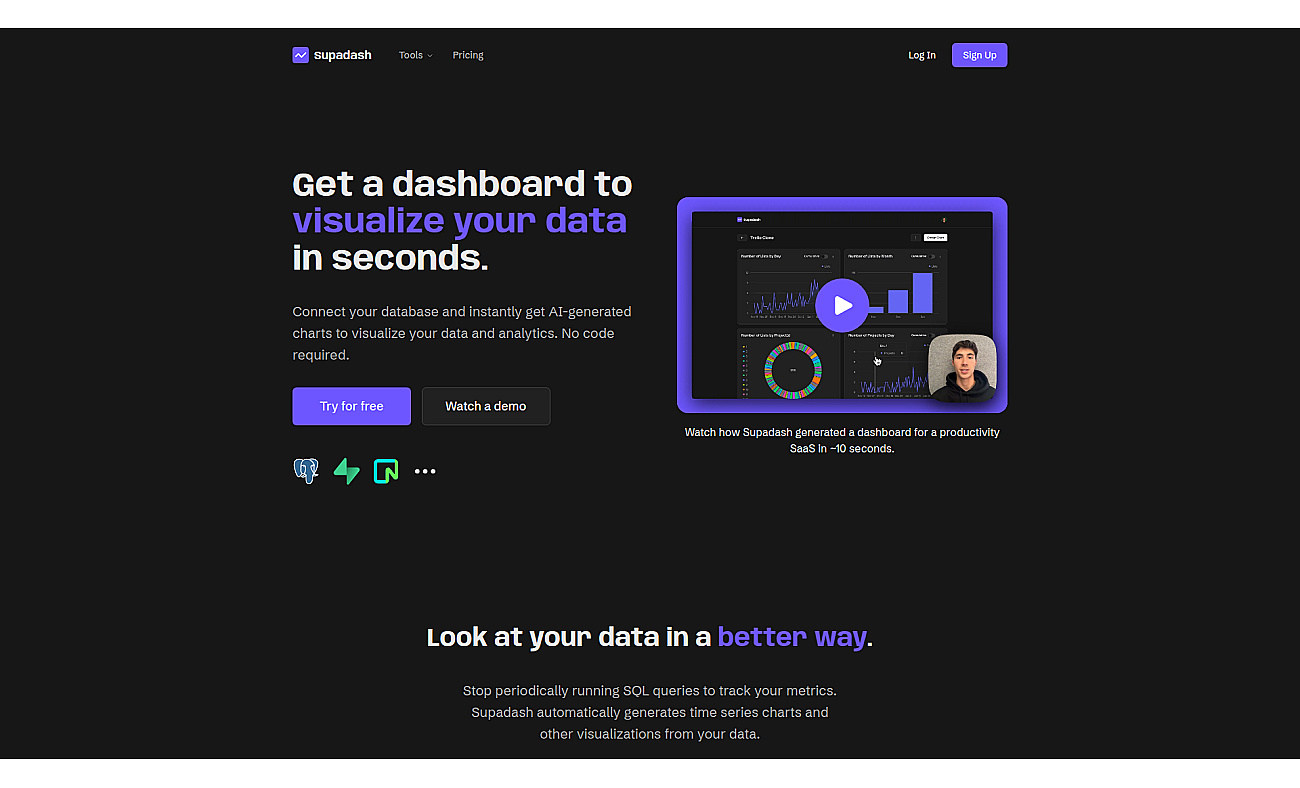
Supadash is designed to transform data into visual charts quickly and without any coding skills. Users connect their databases and generate informative dashboards in moments.
This process eliminates the need for complex SQL queries, allowing for swift analysis of trends and metrics. With a user-friendly interface, it makes data accessible to all, whether for tracking sales, monitoring project progress, or analyzing website traffic. Supadash offers an efficient way to visualize important information, saving time and effort while enhancing understanding of key data points.
Based on overlapping tasks and related categories.
Automated data visualization generator for clear infographics.

Create stunning charts from data with ease and speed.
Transform complex data into clear visual insights effortlessly.

Visualize and analyze data from multiple sources seamlessly.

Create engaging visual reports and dashboards with ease.

Transform data into visual charts using natural language commands.
Discover other similar tools and compare features