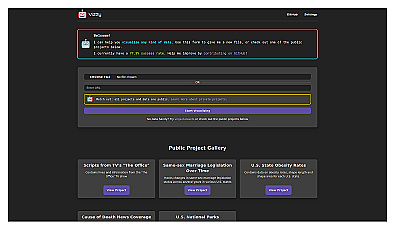
Vizzy
Visualize data insights through intuitive and clear graphics.
Transform complex data into clear visual insights effortlessly.
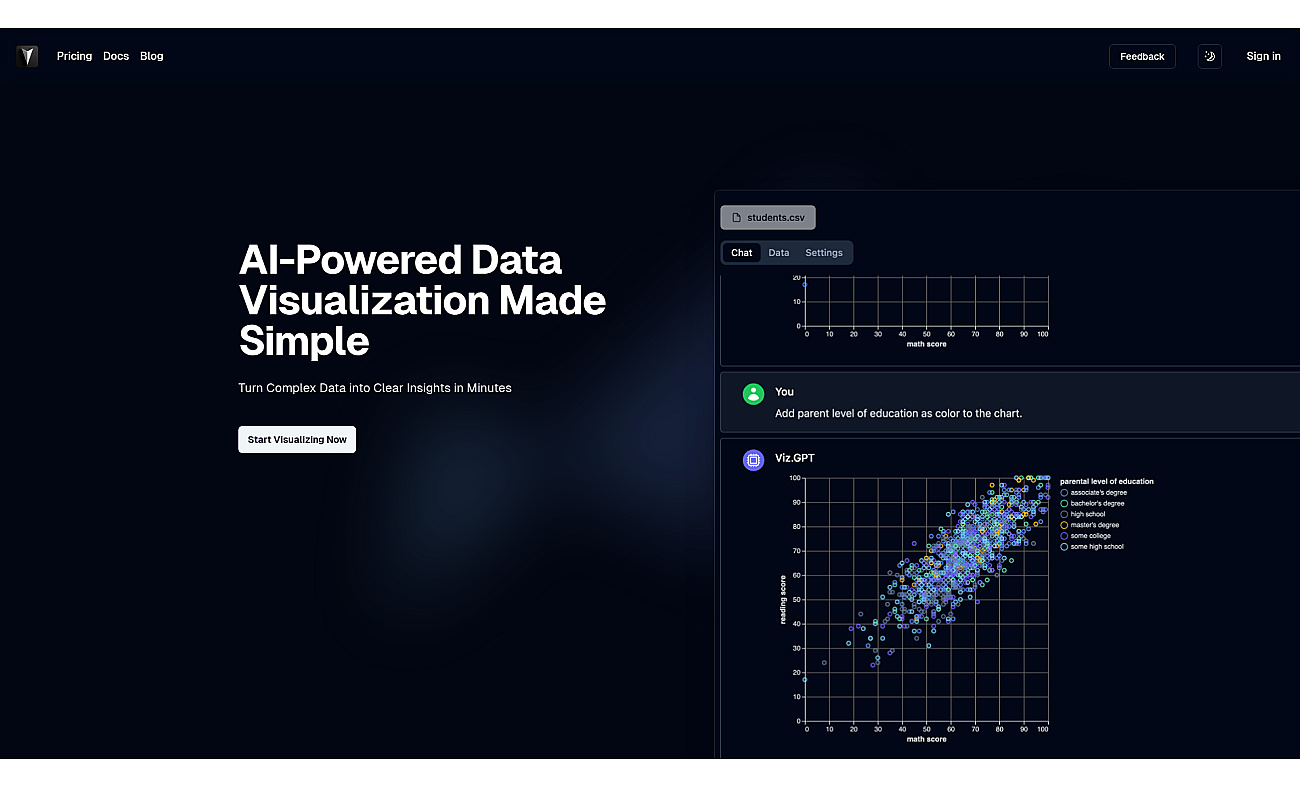
vizGPT is an innovative software that turns complex data into easy-to-understand visuals. Users interact with their data by asking questions in everyday language and receive quick visual responses.
This approach makes data analysis accessible to everyone, regardless of their technical skills.
The system remembers previous queries, allowing users to build on past analyses for a smoother experience.
With vizGPT, generating visual representations of various data sets becomes straightforward. Users can create charts from sales figures, visualize customer feedback, and track performance metrics in real time.
This tool transforms data storytelling and enhances presentations, making insights clear and engaging.
Based on overlapping tasks and related categories.
Visualize data insights through intuitive and clear graphics.

Create engaging visual reports and dashboards with ease.

Automated data visualization generator for clear infographics.

Create stunning charts from data with ease and speed.

Create clear visuals from complex data effortlessly.
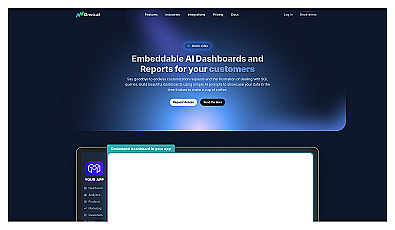
Create dashboards and reports effortlessly with AI prompts.
Discover other similar tools and compare features