
Google Data Studio
Create engaging visual reports and dashboards with ease.
Visualize data insights through intuitive and clear graphics.
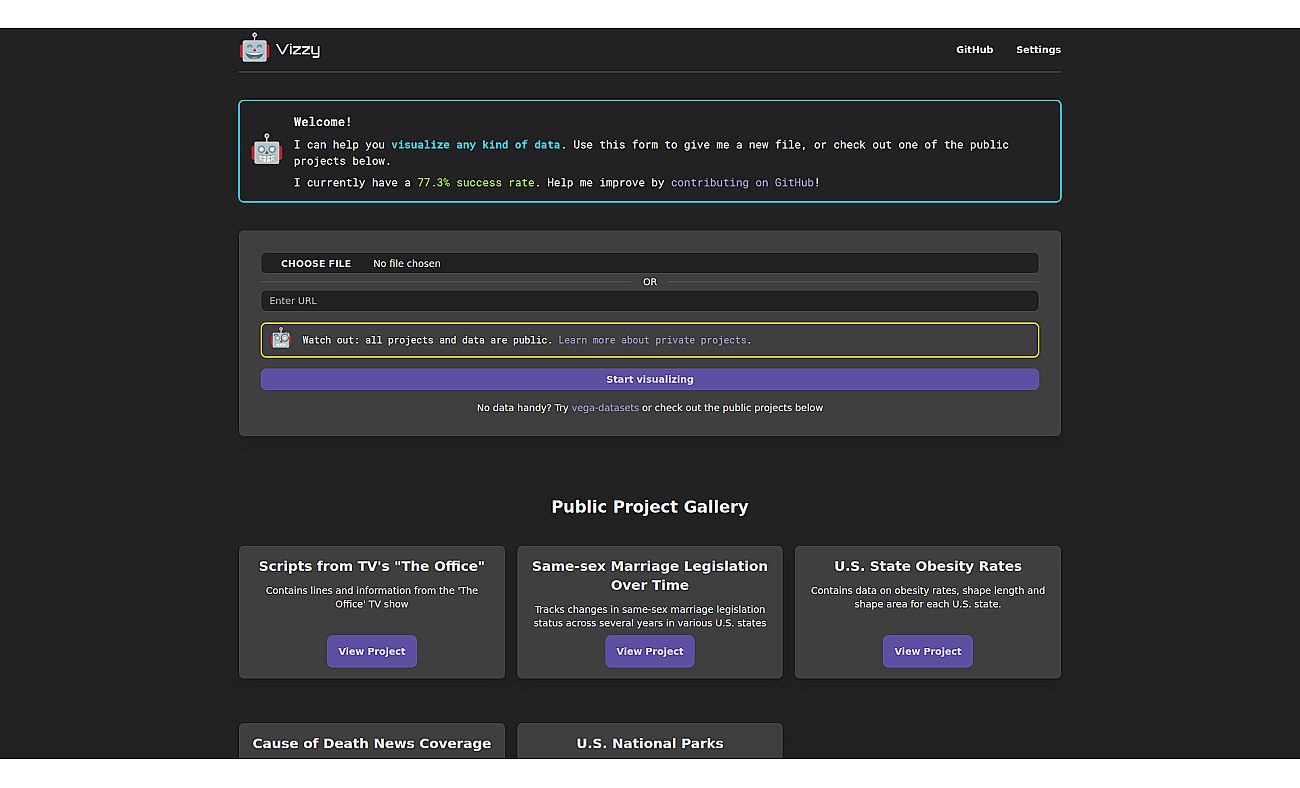
Vizzy is a visualization tool designed for transforming data into clear and engaging graphics. Users input their data, and it generates various types of visuals that make trends and insights easy to understand.
Without needing advanced skills, anyone can create informative representations of their data. This product supports multiple data formats for quick results, aiming to empower informed decisions based on clear insights. Community contributions play a role in enhancing its features and capabilities over time.
From tracking sales trends to summarizing survey results, Vizzy makes data visualization accessible to all, ensuring that users can interpret their information effectively.
Based on overlapping tasks and related categories.
Create engaging visual reports and dashboards with ease.
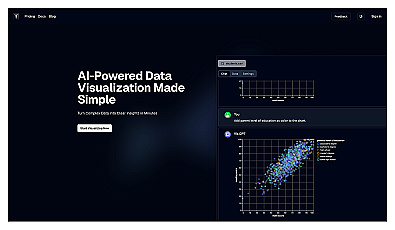
Transform complex data into clear visual insights effortlessly.

Automated data visualization generator for clear infographics.
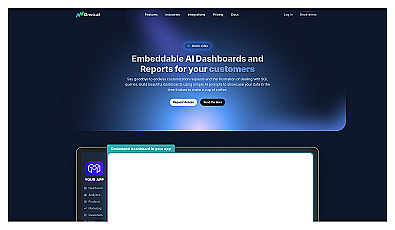
Create dashboards and reports effortlessly with AI prompts.

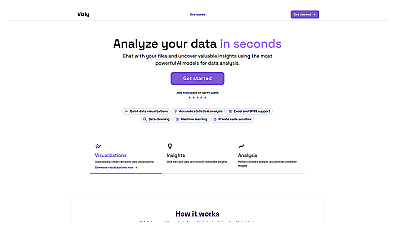
Natural language data visualization for better insights.
Transform complex data into clear insights in seconds.
Discover other similar tools and compare features