
ChatCSV
Natural language data visualization for better insights.

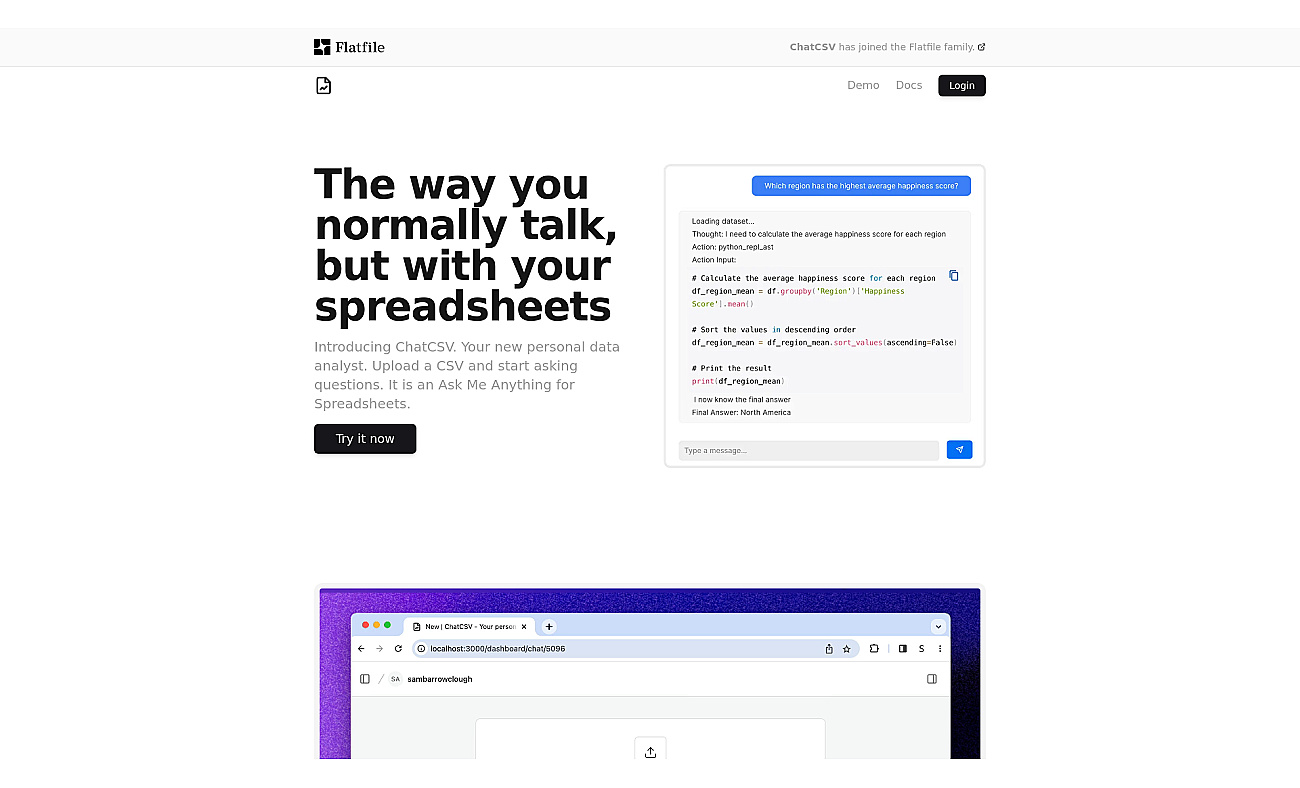
ChatCSV is a data visualization assistant that allows users to upload CSV files and ask questions about their data. This interactive experience turns complex datasets into easy-to-understand visuals, like charts and graphs.
By using natural language queries, users can quickly gain insights and make informed decisions without needing advanced analytical skills. The application is useful for various tasks, such as analyzing sales trends, monitoring inventory levels, and summarizing survey results.
Its ability to track conversation history and generate common questions adds to its effectiveness, making it a valuable resource for anyone looking to better understand their data.
- Analyze sales trends weekly
- Visualize customer demographics easily
- Monitor inventory levels in real time
- Track marketing campaign performance
- Generate financial reports quickly
- Understand user behavior patterns
- Create visual data presentations
- Summarize survey results clearly
- Facilitate team discussions about data
- Streamline data reporting processes
- Easy to use with natural language
- Visualizes data quickly and effectively
- Keeps track of conversation history
- Generates common questions automatically
- Suitable for various industries

Visualize and analyze data from multiple sources seamlessly.

Visualize data effortlessly with natural language insights.

Interactive charts and maps for data visualization.

Create stunning charts from data with ease and speed.

Visual data representation for informed decision-making.
Product info
- About pricing: Free + from $20/m
- Main task: Data visualization
- More Tasks
-
Target Audience
Data analysts Business professionals Marketing teams Finance specialists Educators