
ChartyAI
Create stunning charts from data with ease and speed.
Interactive charts and maps for data visualization.
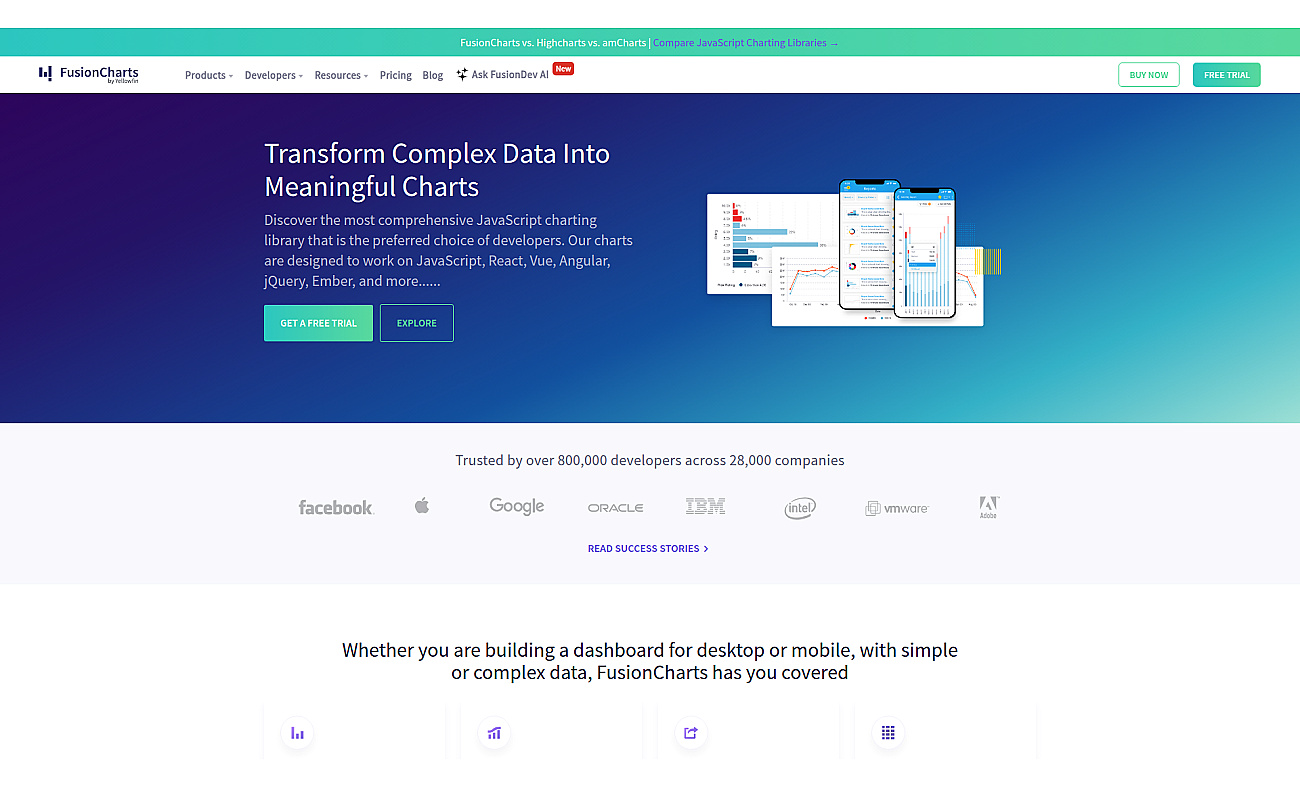
FusionCharts offers a JavaScript charting library that allows users to create interactive charts and maps for web and mobile. This product is accessible to developers at any skill level and integrates smoothly with various frameworks like React and Angular.
Users can visualize data in engaging ways, leading to clearer insights and informed decisions. The platform supports a wide range of chart types, making it useful for tasks like analyzing sales trends, monitoring IoT data, and presenting survey results. With its user-friendly interface and strong customer support, FusionCharts empowers users to build visually appealing dashboards that effectively communicate data.
Based on overlapping tasks and related categories.
Create stunning charts from data with ease and speed.

AI-driven data visualization and SQL query automation.

Create engaging and interactive charts for data visualization.

Visualize and analyze data from multiple sources seamlessly.

Natural language data visualization for better insights.

Transform data into visual charts using natural language commands.
Discover other similar tools and compare features