
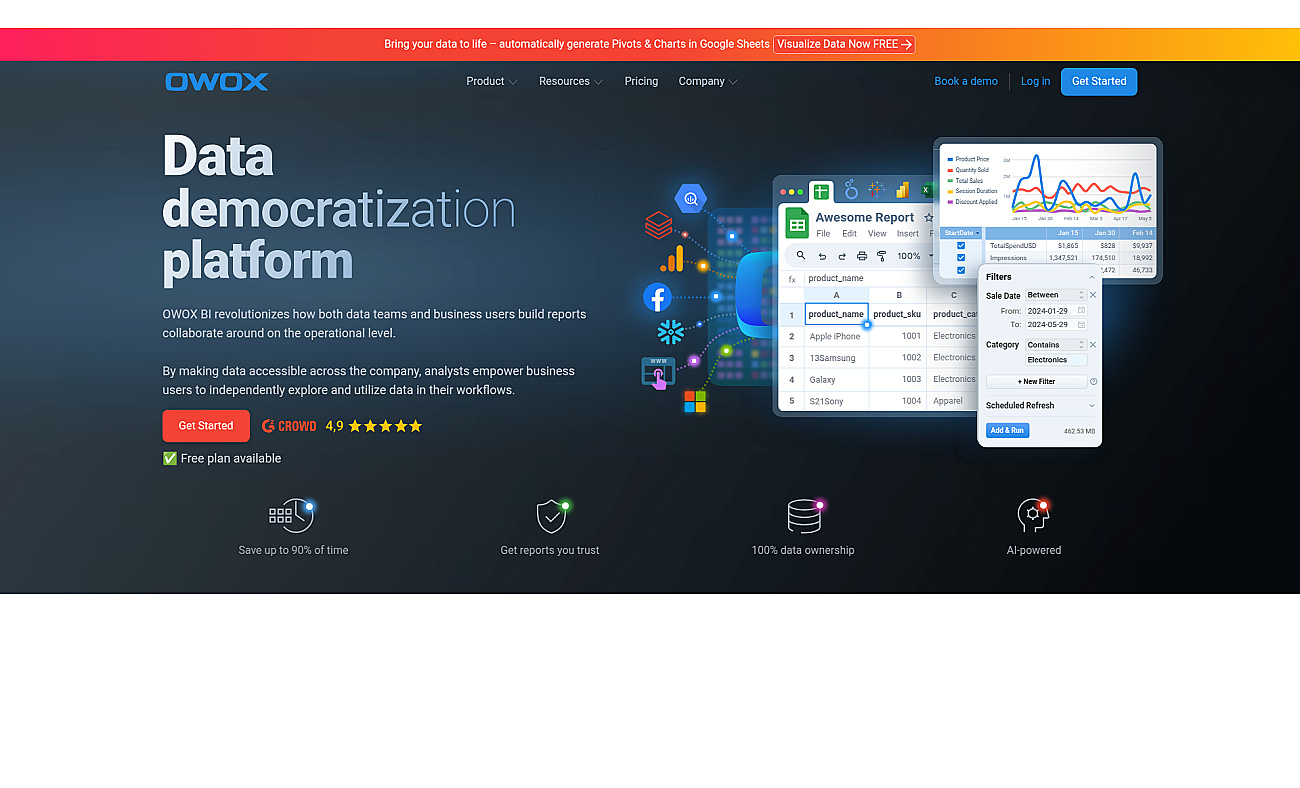
Oogway
Transform complex data into clear insights for better decisions.
Free
Streamlines data visualization and reporting in Google Sheets.
OWOX BI is a powerful data visualization and reporting solution that automatically generates charts and pivot tables in Google Sheets. This allows users to easily understand complex information without needing technical expertise.
Designed for both data professionals and everyday business users, it enables quick exploration of data, leading to faster decision-making.
With customizable templates and seamless integration with Google Sheets, OWOX BI enhances collaboration among team members and simplifies the process of monitoring key business metrics. It is a practical choice for anyone looking to improve their data analysis workflows and create insightful dashboards.
Based on overlapping tasks and related categories.
Transform complex data into clear insights for better decisions.
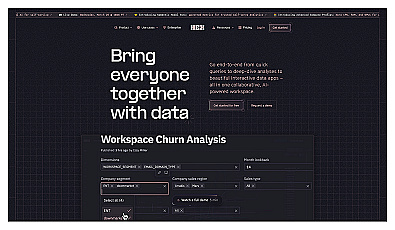
Collaborative data analysis and visualization for teams.
Visualize and analyze data with interactive dashboards.
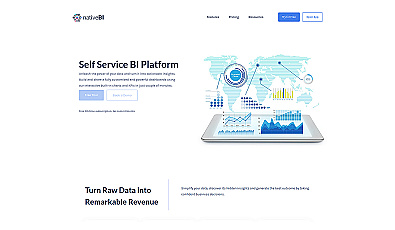
User-friendly data analysis and visualization for teams.
Visual analytics tool for creating insightful reports and dashboards.
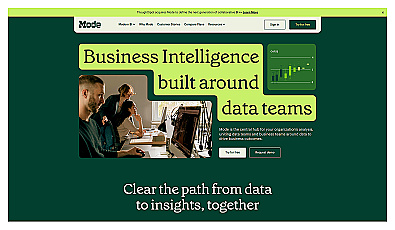
Data analysis platform for collaborative insights and visual reports.
Discover other similar tools and compare features