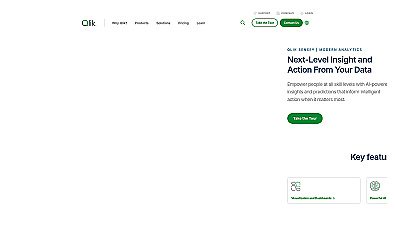
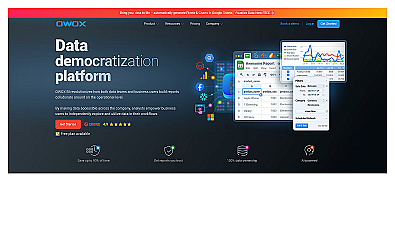
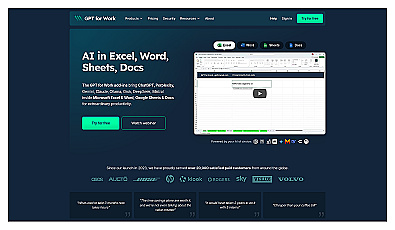
This software is a visual analytics program that allows users to create reports and dashboards easily. It enables exploration of data to uncover patterns and trends, facilitating informed decision-making.
Businesses can respond quickly to changes in their environment through data insights. With features that support real-time data processing and collaborative analysis, it is designed for users of all skill levels.
Companies utilize this program for tasks such as tracking sales performance, monitoring website analytics, and generating financial reports.
By centralizing data-driven insights, it enhances project management and cross-departmental collaboration, making it a valuable asset for data analysis.