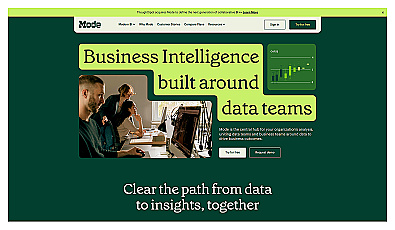
Mode
User-friendly data analysis and visualization for teams.
Collaborative data analysis and visualization for teams.
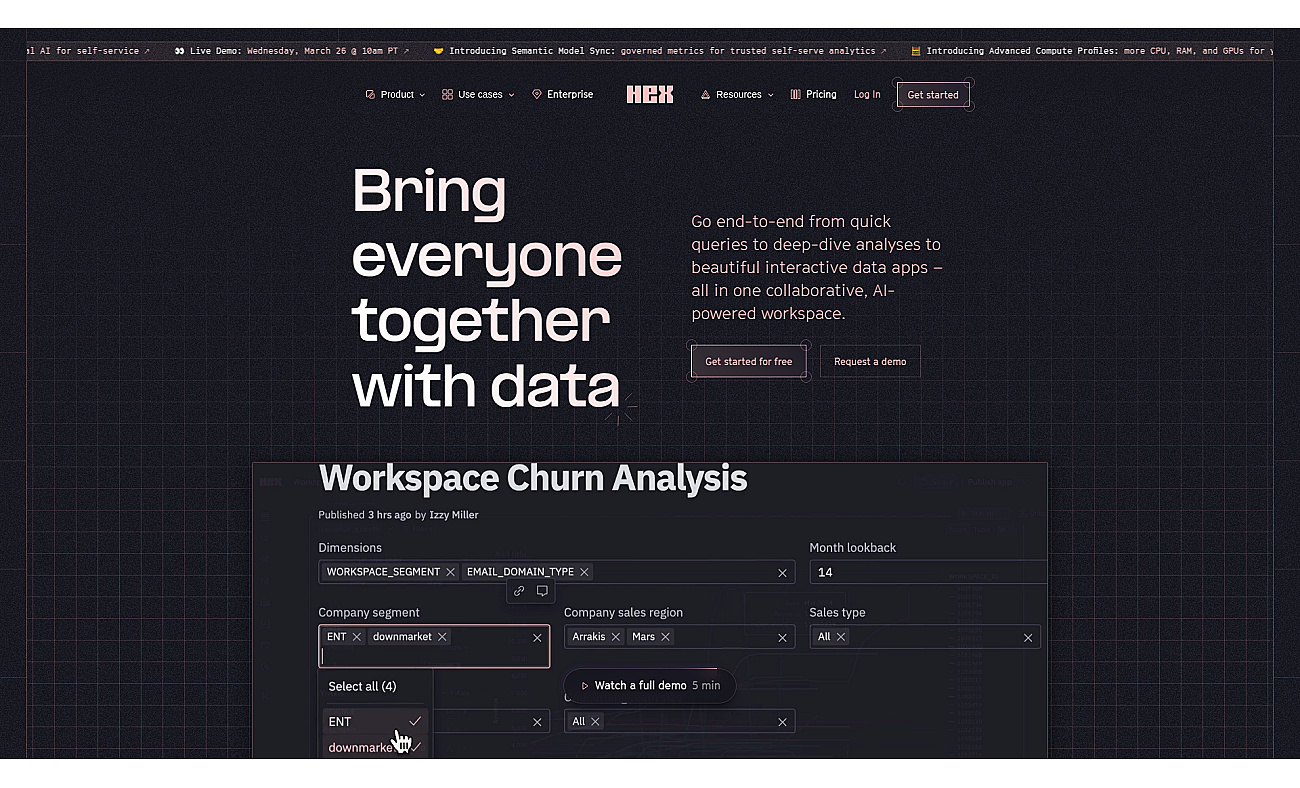
Hex is a collaborative workspace designed for data analysis and visualization. It allows teams to query data quickly, analyze complex information, and create engaging applications in one place.
With an intuitive interface, users can easily generate queries and produce visual representations of their findings. The platform incorporates AI to enhance data exploration, making it straightforward to identify trends and insights. Teams can work together seamlessly, sharing projects and insights in real time.
Whether for analyzing sales trends or visualizing marketing performance, Hex provides the tools needed to streamline data processes and support informed decision-making.
Based on overlapping tasks and related categories.
User-friendly data analysis and visualization for teams.
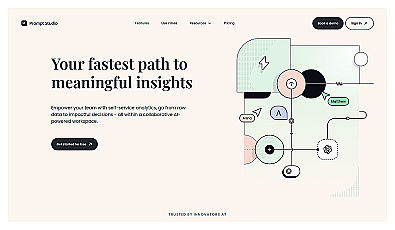
Collaborative data analysis for teams without coding skills.
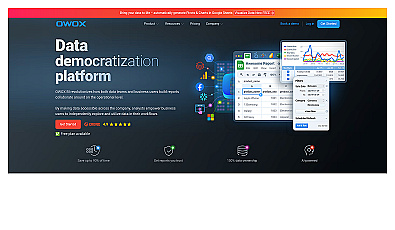
Streamlines data visualization and reporting in Google Sheets.
Visualize and analyze data with interactive dashboards.

Transform complex data into clear insights for better decisions.
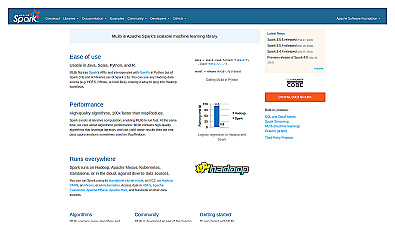
Scalable library for efficient machine learning and data processing.
Discover other similar tools and compare features