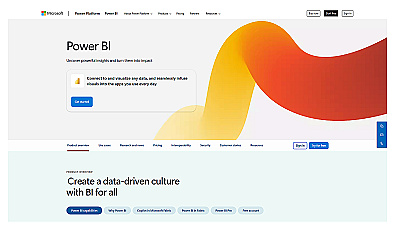
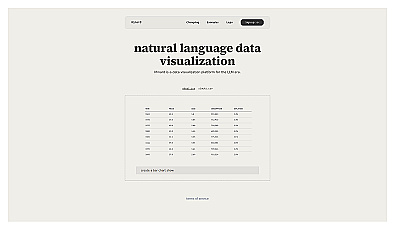
Power BI is a data visualization application that transforms complex information into engaging visuals. Users create interactive reports and dashboards that present data clearly, leading to informed decision-making.
It connects to a variety of data sources and works seamlessly with other Microsoft products, making it versatile for different business needs.
With its real-time data analysis and AI-driven insights, Power BI allows organizations to track performance metrics, visualize trends, and share insights across teams. This application supports users in monitoring everything from sales performance to customer feedback, making complex data accessible and actionable.