Tableau
Visual data representation for informed decision-making.
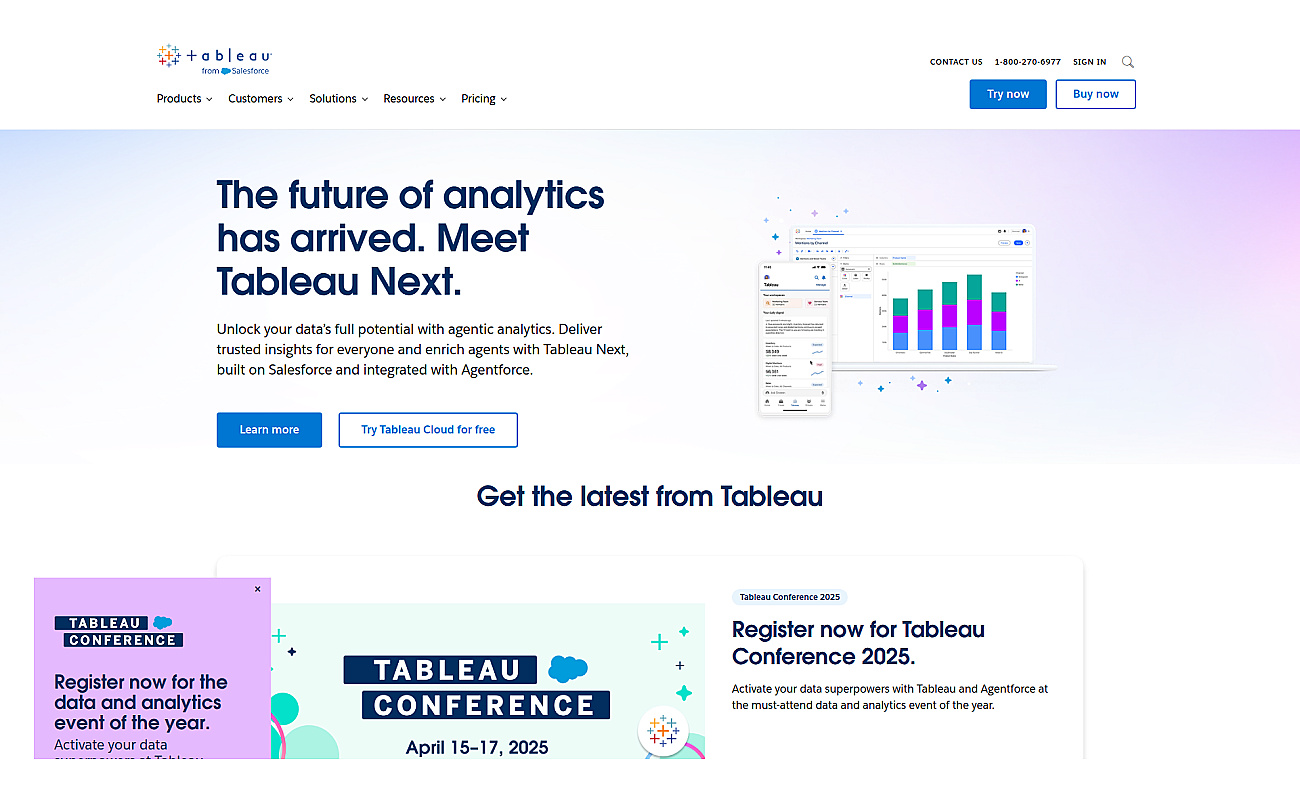
Tableau is a powerful data visualization software that transforms complex information into clear, interactive visuals. It allows users to create engaging charts and dashboards that make data easy to understand and analyze.
Teams can collaborate seamlessly, utilizing real-time data to guide their decisions. This software caters to a wide range of users, from data analysts to business executives, encouraging a culture where employees feel empowered to engage with data. With Tableau, organizations can easily track key performance indicators, monitor marketing efforts, and enhance their reporting capabilities, ultimately leading to smarter, data-driven choices.
- Create interactive business dashboards
- Analyze sales performance trends
- Visualize customer demographics easily
- Monitor marketing campaign effectiveness
- Track financial KPIs in real time
- Enhance data storytelling for presentations
- Identify supply chain inefficiencies
- Optimize product pricing strategies
- Facilitate healthcare data reporting
- Generate insights for strategic planning
- User-friendly interface
- Powerful visualization capabilities
- Supports collaboration across teams
- Integrates with various data sources
- Real-time data analysis
Looking for alternatives?
Discover similar tools and compare features
Product info
- About pricing: Subscription + from $15/user/m
- Main task: 📊 Data analysis
- More Tasks
-
Target Audience
Business Analyst Data Scientist Marketing Manager Sales Executive IT Manager