Google Charts
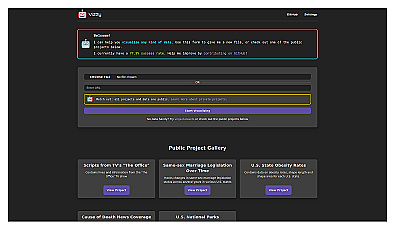
Create engaging and interactive charts for data visualization.
Create engaging and interactive charts for data visualization.

Visualize data to uncover insights and support decision-making.
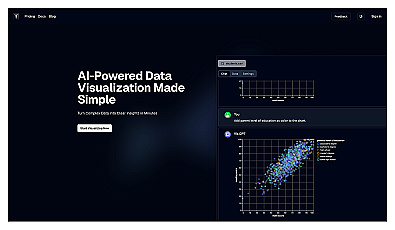
Transform complex data into clear visual insights effortlessly.
Visualize data insights through intuitive and clear graphics.

Create engaging charts effortlessly from your data.
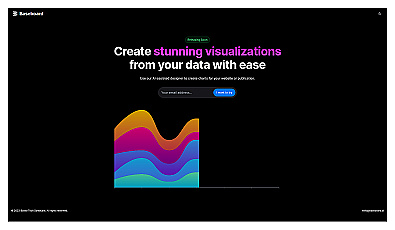
Transform complex data into clear and engaging visuals.
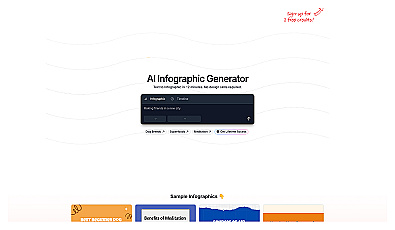
Transform text into visually engaging infographics effortlessly.

Create stunning graphs from raw data effortlessly.

AI-driven assistant for crafting academic and professional papers.
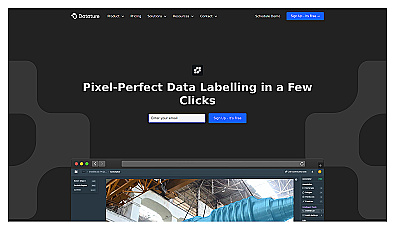
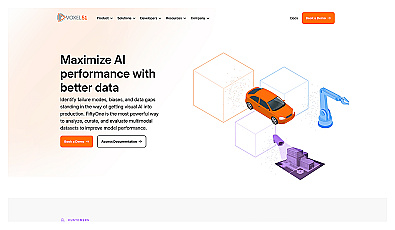
An intuitive image annotation solution for precise labeling.
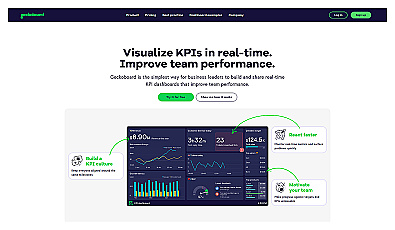
Visualize team performance with real-time KPI dashboards.
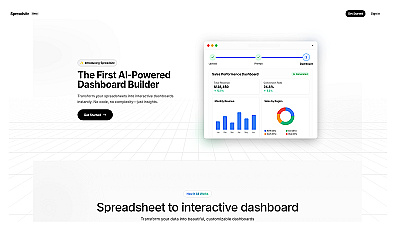
Transform spreadsheets into interactive dashboards effortlessly.
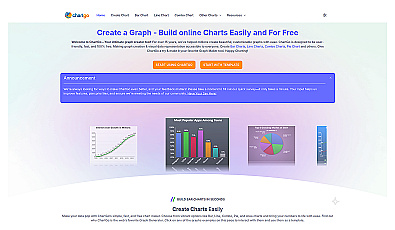
Create various customizable charts for visual data representation.

Create clear visuals from complex data effortlessly.
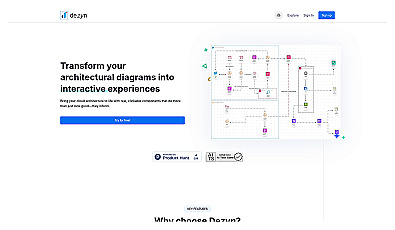
Create interactive cloud diagrams with rich features and collaboration.