NativeBI
Visualize and analyze data with interactive dashboards.
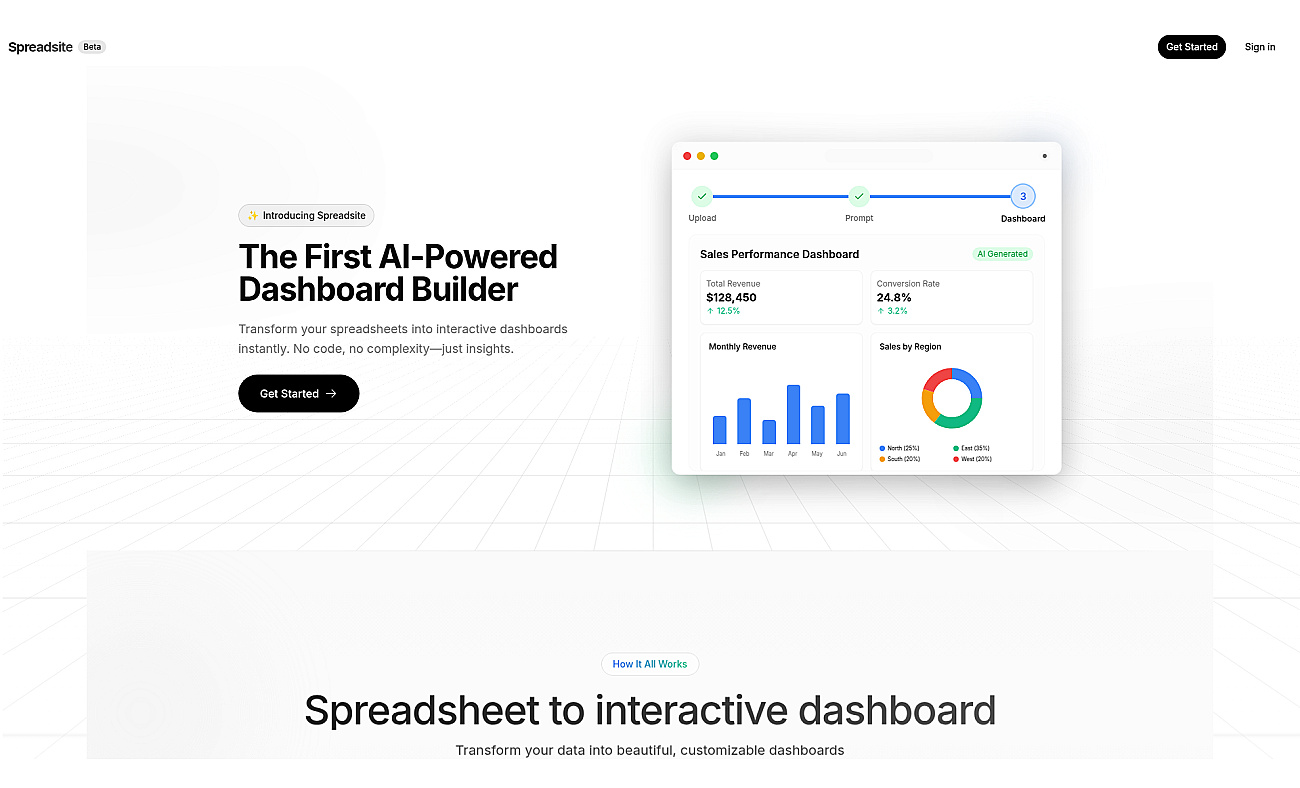
Transform spreadsheets into interactive dashboards effortlessly.
Spreadsite transforms spreadsheets into engaging dashboards that make data easy to understand. Users upload their data in formats like CSV, Excel, or Google Sheets.
After uploading, they can enter a prompt to guide the creation of their dashboard. The AI then generates a visual representation of the data, making it accessible at a glance. Once the dashboard is ready, users can customize it to suit their needs and share it with colleagues or clients.
This promotes teamwork and enhances insights. Spreadsite is useful for visualizing sales performance, tracking marketing campaigns, and analyzing various metrics like finances or customer feedback.
Based on overlapping tasks and related categories.
Visualize and analyze data with interactive dashboards.
Data management and visualization for informed decision-making.

Turn complex data into clear insights effortlessly.

Real-time data integration and visualization for informed decision-making.

Transforms data into engaging visual reports for better insights.

Collaborative data analysis for teams without coding skills.
Discover other similar tools and compare features