Reporfy

Reporfy

Transforms data into engaging visual reports for better insights.

Visit Website
Reporfy screenshot

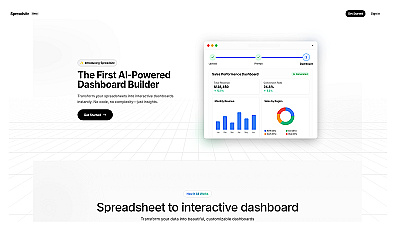
Reporfy turns raw data into visual reports that make information clear and engaging. This platform allows users to create reports that simplify complex data, making it easier to understand insights.

Teams can work together effectively, sharing information without hassle. With its user-friendly design, anyone can generate reports that not only inform but also inspire action. By using Reporfy, data becomes a powerful means of communication and enables better decision-making.

Whether visualizing sales metrics or analyzing customer feedback, this product enhances collaboration and improves how teams present information during meetings.


  • Create engaging project status updates
  • Visualize sales performance metrics
  • Build marketing campaign reports
  • Analyze customer feedback trends
  • Simplify financial performance reviews
  • Enhance team collaboration on reports
  • Automate report generation processes
  • Share insights with stakeholders easily
  • Track project milestones visually
  • Improve data presentation for meetings
  • Transforms static data into engaging visuals
  • Facilitates team collaboration
  • Integrates with various tools for seamless reporting
  • AI-powered insights enhance decision-making
  • User-friendly interface promotes ease of use


Spreadsite

Transform spreadsheets into interactive dashboards effortlessly.

Grapha AI

AI-powered data exploration and visualization platform.

Graphy app

Create clear visuals from complex data effortlessly.

vizGPT

Transform complex data into clear visual insights effortlessly.

Brainwave

Visualize complex data for insightful decision-making.

Storytell.ai

Turn complex data into clear insights effortlessly.

Microsoft Power BI

Visualize data to uncover insights and support decision-making.

Oogway

Transform complex data into clear insights for better decisions.

Product info