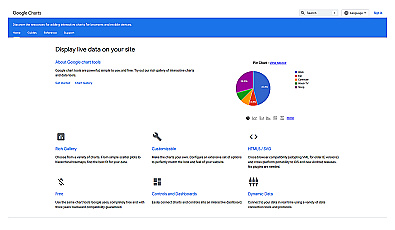
Google Charts
Create engaging and interactive charts for data visualization.
Free
Create interactive web applications from data scripts effortlessly.

RoleBot is a versatile tool for building interactive web applications using data scripts. It allows users to transform their analytical work into visual applications without requiring extensive coding knowledge.
This accessibility encourages collaboration among data scientists and analysts, making it easier to share and discuss insights. Users host their applications online, which promotes teamwork and enhances the presentation of data. RoleBot supports a variety of uses, from creating dashboards that visualize research findings to developing educational resources.
By simplifying the process of showcasing data, RoleBot enables users to focus on insights rather than technical details.
Create engaging and interactive charts for data visualization.
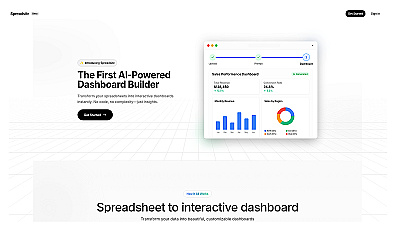
Transform spreadsheets into interactive dashboards effortlessly.
Advanced image analysis and text extraction for various industries.
Generate customized landing pages quickly and effortlessly.
Framework for building dynamic web applications efficiently.
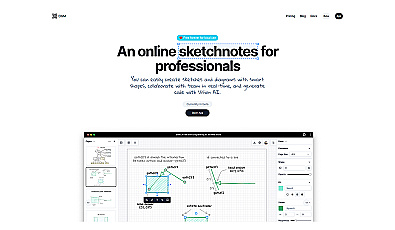
Create interactive sketchnotes and diagrams seamlessly.