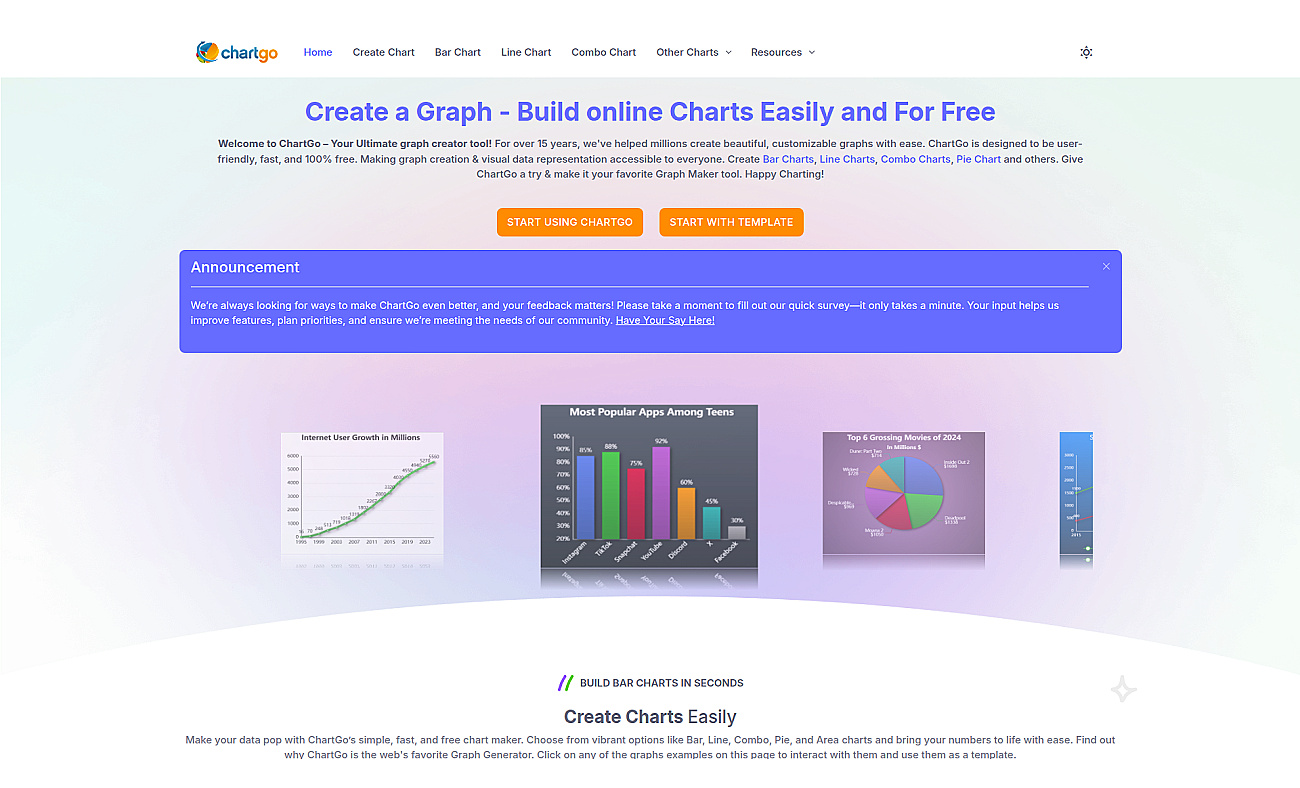
ChartGo provides a straightforward way to create different types of charts, such as bar, line, pie, and area charts. Users can easily customize their graphs to reflect specific data needs.
This online resource allows anyone to start making charts without signing up, making it accessible for all. ChartGo is useful for visualizing data trends, analyzing research results, and enhancing presentations. It serves educators, businesses, and anyone aiming to convey information clearly through visuals.
With this platform, complex data becomes easy to understand and share, facilitating better communication and insight dissemination.