
LIDA
Automated data visualization generator for clear infographics.
Interactive data visualization components for clear insights.
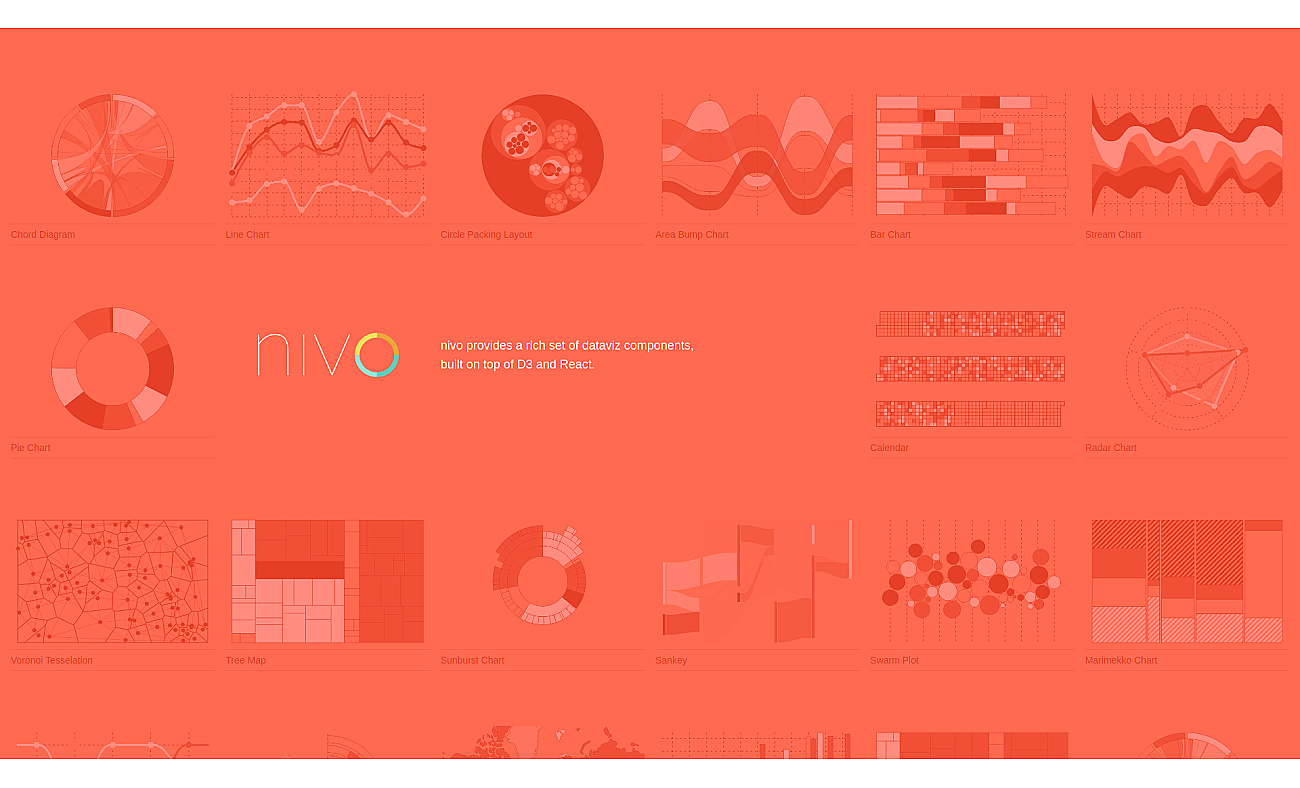
This product consists of data visualization components that create engaging charts and graphs. It transforms complex information into easy-to-understand visuals.
With support for various chart types, users can visualize data through bar charts, line charts, and more intricate formats like sunburst charts. Developers can integrate this product effortlessly with popular technologies such as D3 and React. It allows for highly customizable presentations of data, making it suitable for various contexts, from tracking sales trends to displaying survey results.
The end result is a more accessible way to communicate insights and data relationships, enhancing user engagement.
Based on overlapping tasks and related categories.
Automated data visualization generator for clear infographics.

Create stunning charts from data with ease and speed.

Create engaging and interactive charts for data visualization.

Transform data into visual charts using natural language commands.

Interactive charts and maps for data visualization.

Create engaging charts effortlessly from your data.
Discover other similar tools and compare features