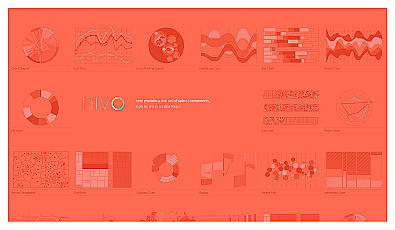
Nivo
Interactive data visualization components for clear insights.
Free
Create engaging charts effortlessly from your data.
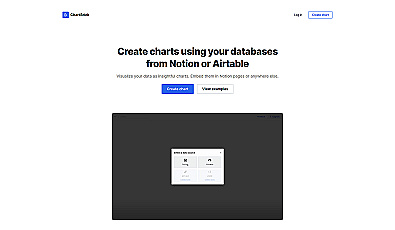
ChartBrick is designed for visualizing data clearly and attractively. Users can create various chart types, like pie and bar charts, without needing technical skills.
It integrates smoothly with popular applications such as Notion and Airtable, allowing easy data import. This product allows for quick customization of charts, enabling users to enhance reports or presentations efficiently. Embedded charts are responsive, ensuring they look great on any device.
Whether it's for business meetings, research findings, or educational materials, ChartBrick makes data visualization accessible for everyone.
Interactive data visualization components for clear insights.
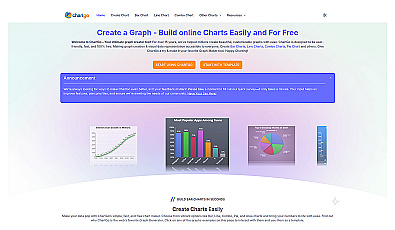
Create various customizable charts for visual data representation.
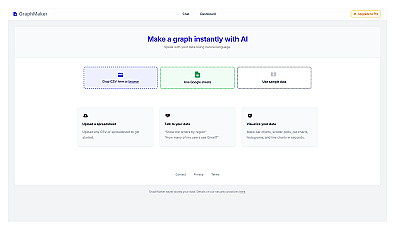
Create various types of charts from data effortlessly.
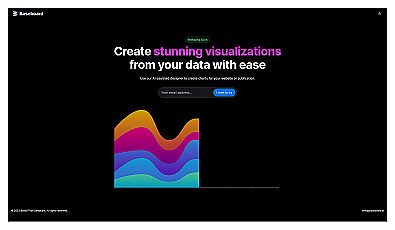
Transform complex data into clear and engaging visuals.
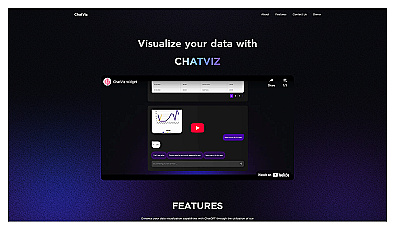
AI-driven data visualization and SQL query automation.
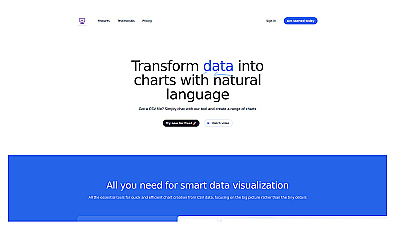
Transform data into visual charts using natural language commands.