
LIDA
Automated data visualization generator for clear infographics.
Create various types of charts from data effortlessly.
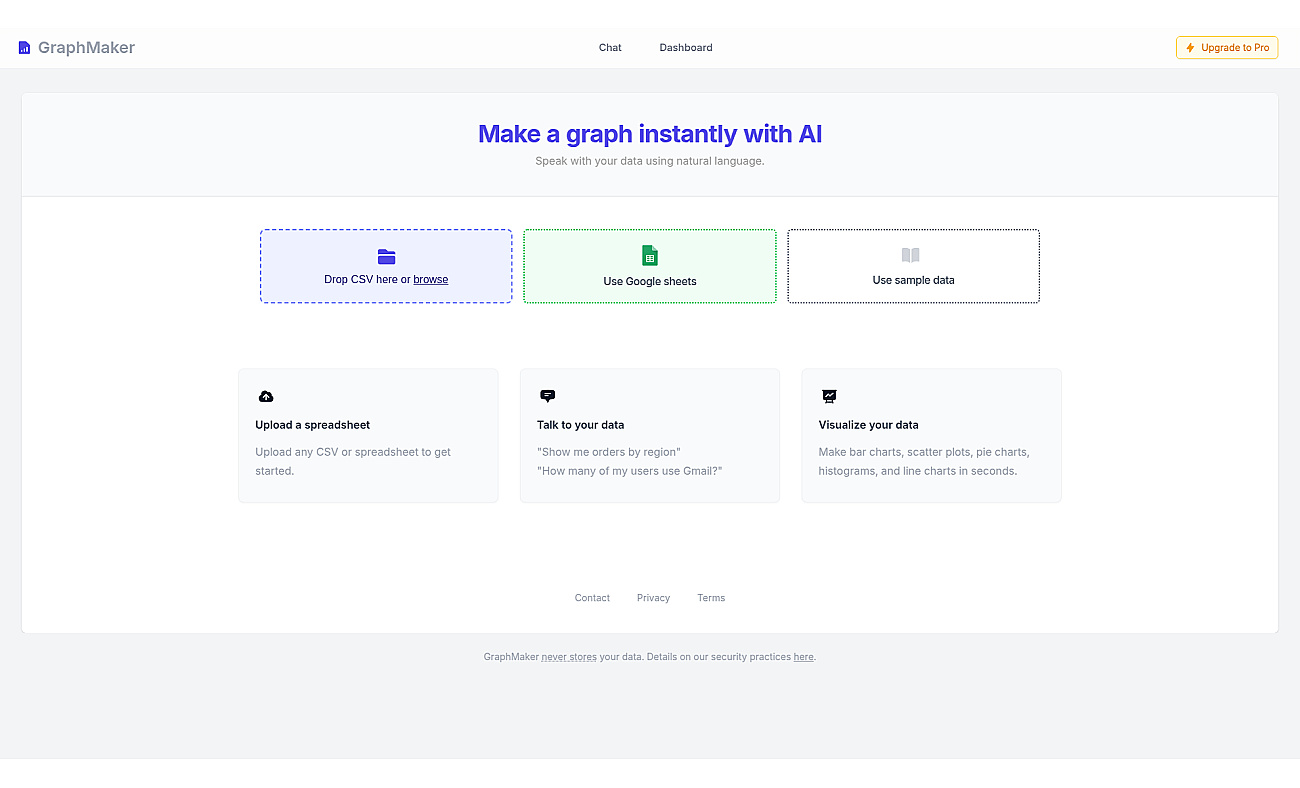
Graph Maker is a user-friendly application designed to create visual representations of data. This software transforms raw data into various chart formats, such as bar and pie charts, making it accessible for anyone.
Users can easily upload their data files or connect directly with Google Sheets for seamless integration.
By asking for specific insights, individuals can visualize trends and results quickly. Whether it’s for business presentations, academic reports, or personal projects, Graph Maker simplifies the process of data visualization, allowing users to focus on understanding their information rather than struggling with complicated software.
Based on overlapping tasks and related categories.
Automated data visualization generator for clear infographics.

Transform data into visual charts using natural language commands.

Create stunning charts from data with ease and speed.

Create engaging and interactive charts for data visualization.

Interactive charts and maps for data visualization.

Visualize data to uncover insights and support decision-making.
Discover other similar tools and compare features