
Graphy app
Create clear visuals from complex data effortlessly.
Create professional line charts to visualize data trends easily.
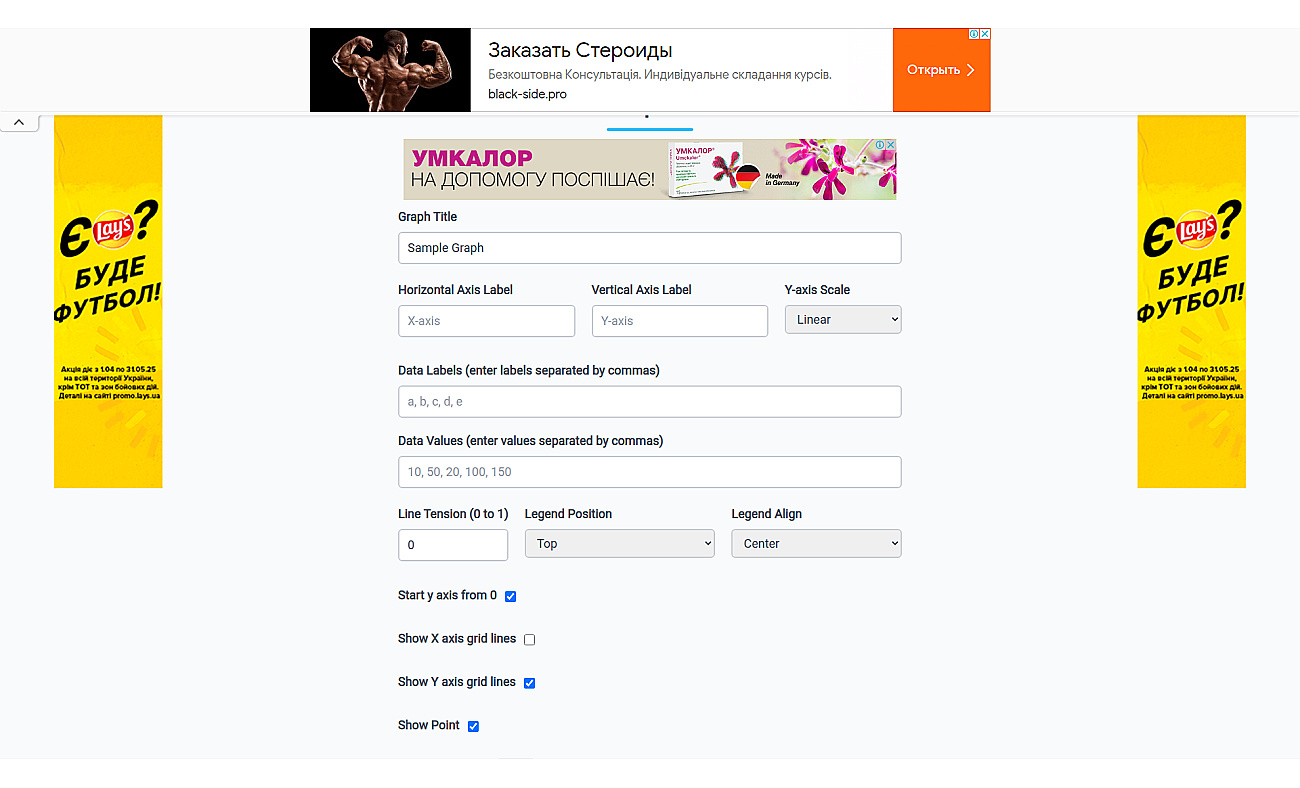
Line Graph Maker allows users to create line graphs that show trends and changes over time. With a simple interface, individuals can input data points, label axes, and customize how their graphs look.
This results in a polished line chart that clearly presents the data.
Users do not need advanced design or analysis skills to create these visualizations. Line Graph Maker enables quick edits and offers various download options, making it easy to share graphs for reports, presentations, or personal projects.
This product makes data visualization straightforward, ensuring that anyone can understand and communicate their findings effectively.
Based on overlapping tasks and related categories.
Create clear visuals from complex data effortlessly.

Create engaging and interactive charts for data visualization.
Create various types of charts from data effortlessly.
Transform complex data into clear visual insights effortlessly.

Create stunning charts from data with ease and speed.

Automated data visualization generator for clear infographics.
Discover other similar tools and compare features