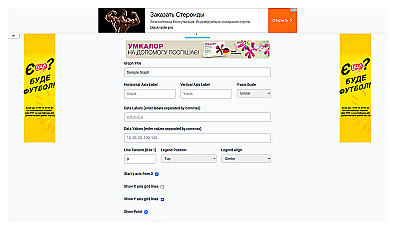
Line Graph maker
Create professional line charts to visualize data trends easily.
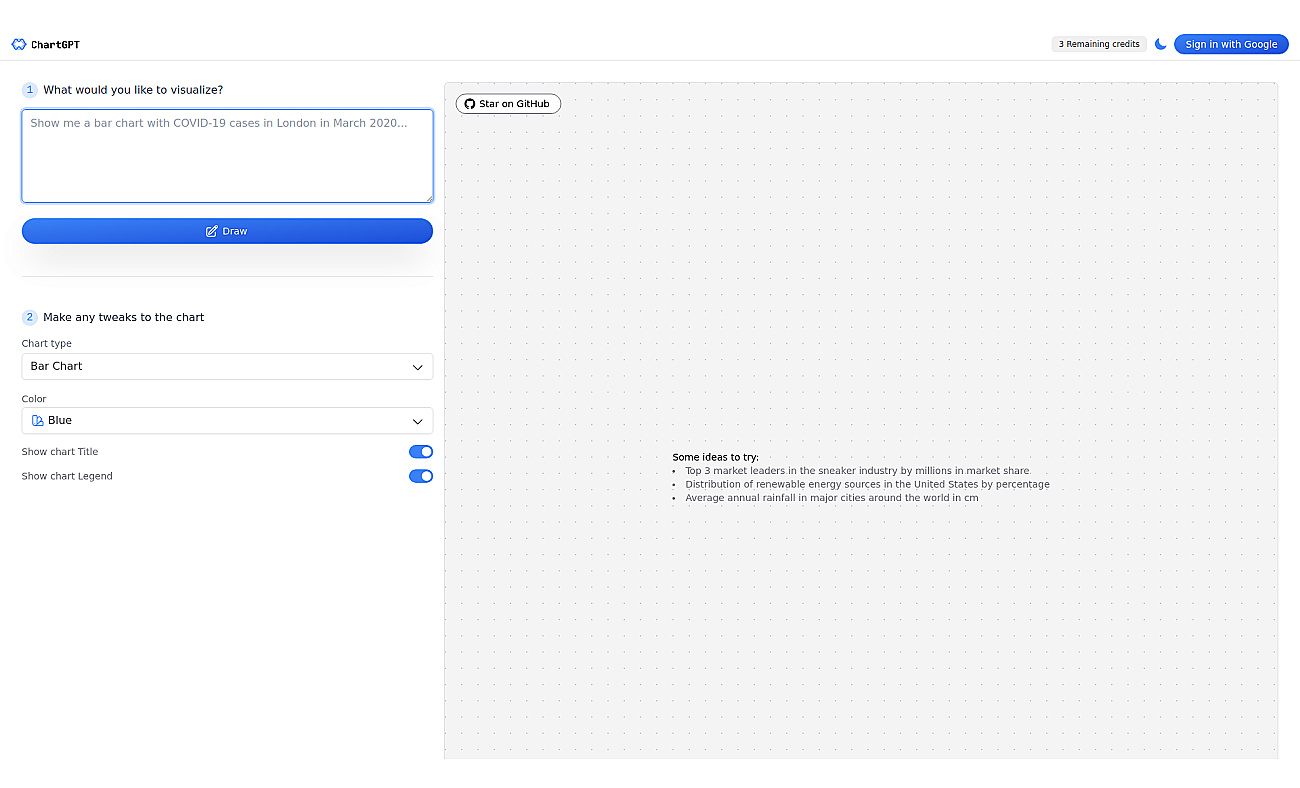
Create engaging charts from data with ease.
ChartGPT is a user-friendly program designed for creating a variety of charts quickly. Users input their data and select their preferred chart type to generate clear visual representations.
This tool simplifies the process of understanding complex information, making it accessible to everyone. With options for bar charts, sales trends, survey analyses, and more, ChartGPT provides flexibility in how data can be displayed.
It helps reveal insights into population statistics, project timelines, budget allocations, and other important metrics.
This makes it a valuable asset for anyone needing to visualize data effectively, regardless of their background.
Based on overlapping tasks and related categories.
Create professional line charts to visualize data trends easily.

Conversational data analysis for informed business decisions.
A user-friendly chat client for interacting with various AI models.

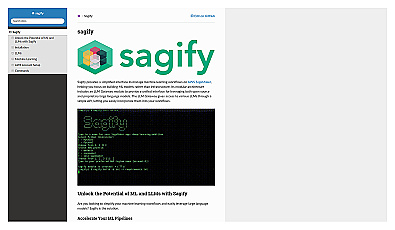
Streamlined machine learning model development and deployment.
Accelerate machine learning with continuous model training and monitoring.
Discover other similar tools and compare features