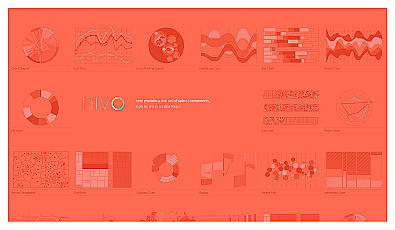
Nivo
Interactive data visualization components for clear insights.
Free
Create engaging interactive data visualizations effortlessly.
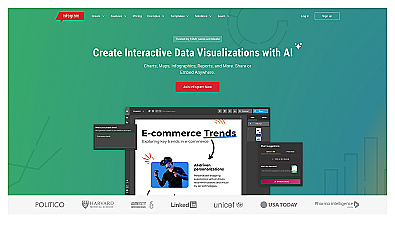
Infogram is a resource for producing interactive graphics and visual content. It enables users to transform detailed data into expressive infographics, charts, and reports.
Businesses, educators, and marketers utilize Infogram to share their visual information on websites and social media platforms.
This resource simplifies the process of customizing visuals and updating data instantly, ensuring information remains current.
Users can create effective presentations that engage audiences and communicate messages clearly. With a user-friendly interface and a range of templates, Infogram makes designing compelling graphics enjoyable and efficient.
Interactive data visualization components for clear insights.
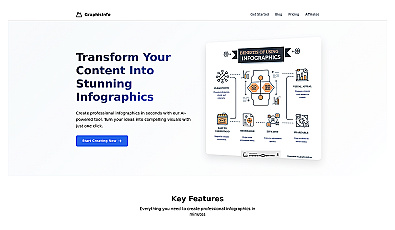
Create stunning infographics quickly with AI-powered design.
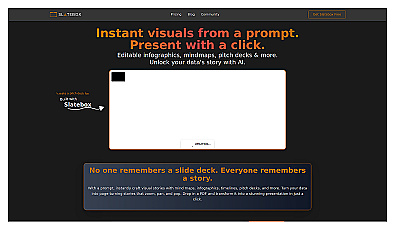
Create engaging visuals from data for presentations.

Create clear visuals from complex data effortlessly.
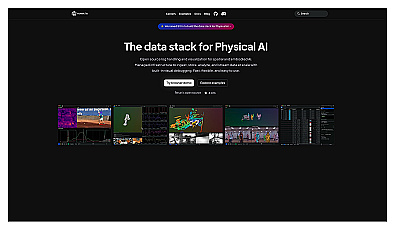
Open-source logging and visualization for AI data management.
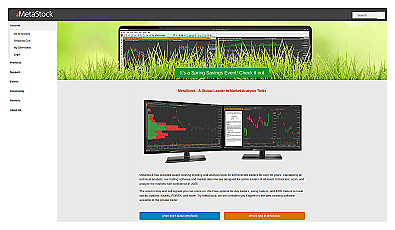
Advanced market analysis and charting for traders of all levels.