
LIDA
Automated data visualization generator for clear infographics.

Open-source logging and visualization for AI data management.
Rerun is a versatile logging and visualization system designed for spatial and embodied AI applications. Users can run their systems, record data, and visualize it in real-time without complex installations.
By providing clear visual representations of information, Rerun makes it easier to analyze and debug projects. It supports multiple programming languages, including Python, C++, and Rust, catering to a wide range of users.
This product streamlines workflows in data management, allowing for effective logging of real-time sensor data and interactive visualizations. Researchers and educators alike benefit from Rerun, as it enhances understanding of AI processes and assists in documenting findings.
Based on overlapping tasks and related categories.
Automated data visualization generator for clear infographics.

Visualize and analyze data from multiple sources seamlessly.

Create stunning charts from data with ease and speed.
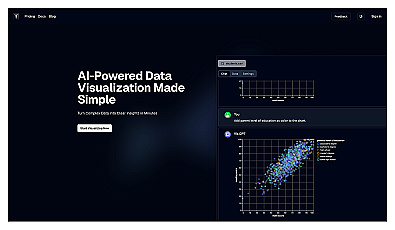
Transform complex data into clear visual insights effortlessly.

AI-driven data visualization and SQL query automation.

Transform data into visual charts using natural language commands.
Discover other similar tools and compare features