Data Representation Tools
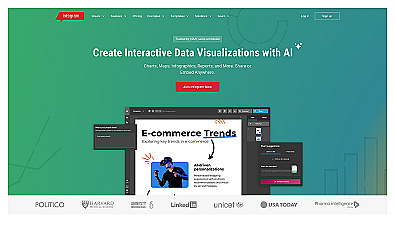
Create engaging interactive data visualizations effortlessly.
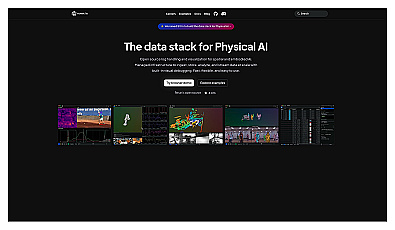
Open-source logging and visualization for AI data management.
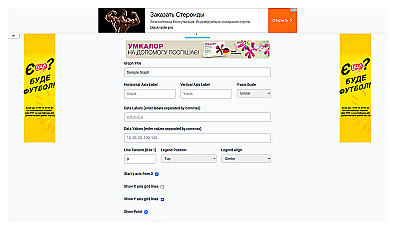
Create professional line charts to visualize data trends easily.

Create engaging and interactive charts for data visualization.

AI-powered code generator for Python scripts and learning coding.
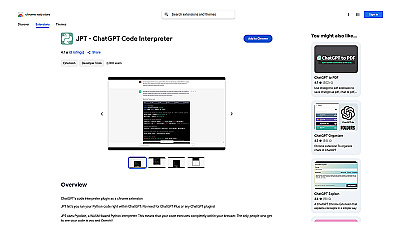
Instantly run Python code directly in your browser.

Automated data visualization generator for clear infographics.
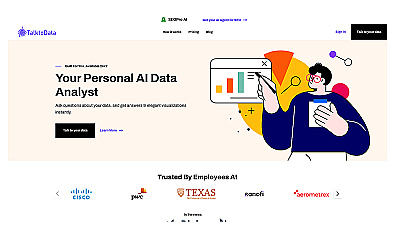
Automated data analysis using Generative AI for everyone.
Data analysis made accessible for all levels of expertise.
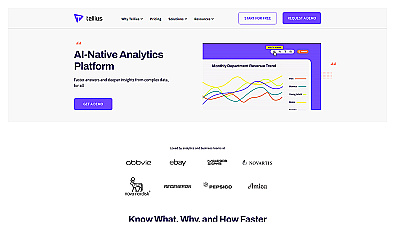
Transform complex data into clear insights effortlessly.
AI-powered assistant for effortless data queries and insights.

Create clear visuals from complex data effortlessly.

Visualize data to uncover insights and support decision-making.
Create various types of charts from data effortlessly.

Interactive charts and maps for data visualization.
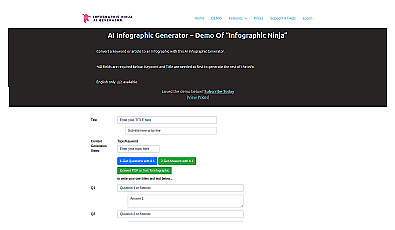
Design captivating infographics to visualize complex information clearly.

Create engaging charts effortlessly from your data.
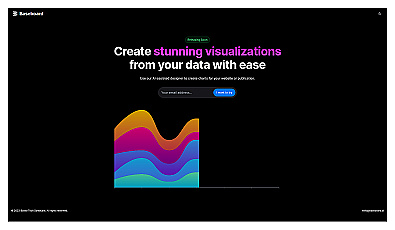
Transform complex data into clear and engaging visuals.

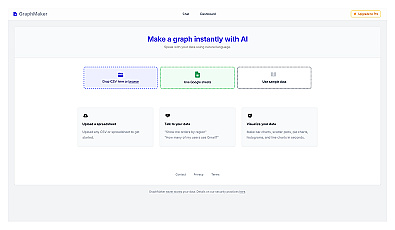
Create stunning graphs from raw data effortlessly.

Interactive data visualization components for clear insights.

Transform data into visual charts using natural language commands.

Create stunning charts from data with ease and speed.
Transform complex data into clear visuals and insights.

Visualize and analyze data from multiple sources seamlessly.