Visual Data Analysis Tools
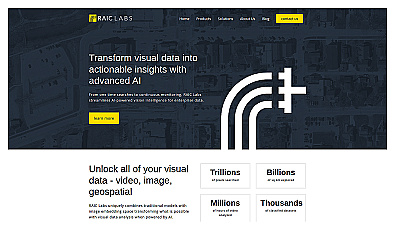
Advanced AI for swift visual data analysis and monitoring.

Create engaging and interactive charts for data visualization.
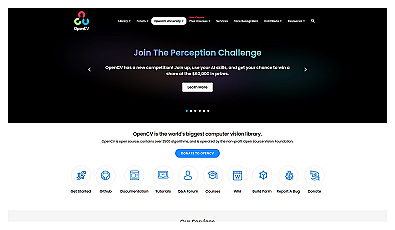
Powerful library for computer vision tasks and image processing.

Create clear visuals from complex data effortlessly.

Automated data visualization generator for clear infographics.
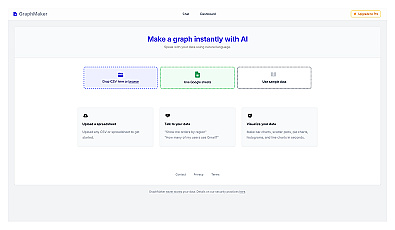
Create various types of charts from data effortlessly.
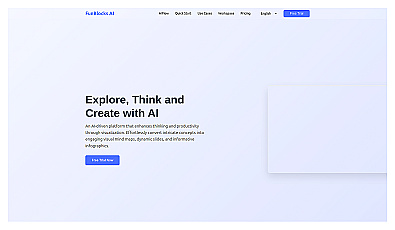
Visualize and organize thoughts with clarity and creativity.

Visualize data to uncover insights and support decision-making.

Interactive charts and maps for data visualization.

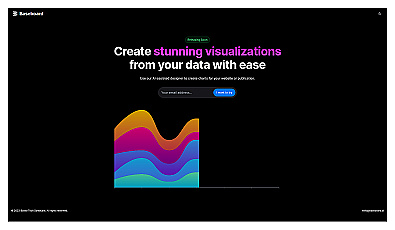
Create stunning charts from data with ease and speed.

Create engaging charts effortlessly from your data.
Transform complex data into clear and engaging visuals.

Create stunning graphs from raw data effortlessly.

Visualize and analyze data from multiple sources seamlessly.

AI-driven data visualization and SQL query automation.

Transform data into visual charts using natural language commands.
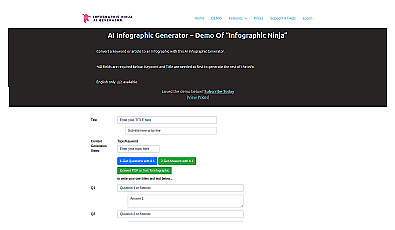
Design captivating infographics to visualize complex information clearly.

Interactive data visualization components for clear insights.
Visualize data effortlessly with natural language insights.

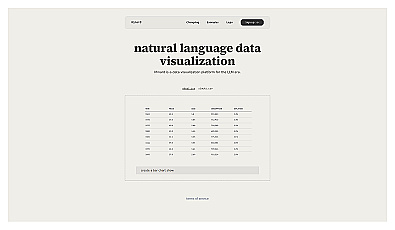
Natural language data visualization for better insights.

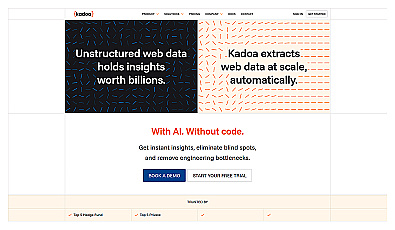
Automated data extraction from unstructured web sources.

Personalized soundscapes to boost focus and reduce stress.
An AI conversation assistant that delivers quick, clear answers.
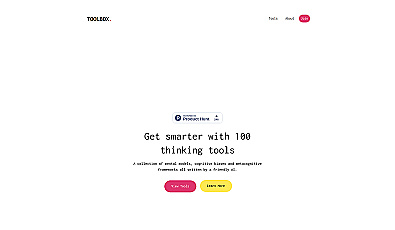
Enhance your thinking with diverse cognitive strategies.