Data Visualization For Effective Clarity Tools
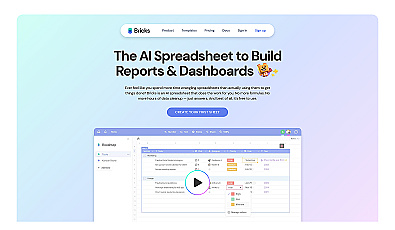
AI-powered spreadsheet for quick reports and data visuals.
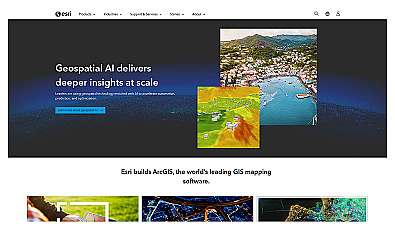
Spatial data visualization and analysis for informed decision-making.
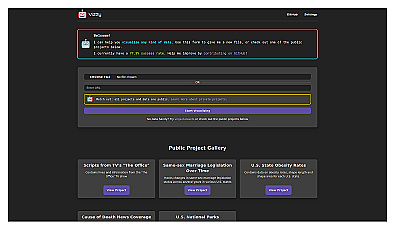
Visualize data insights through intuitive and clear graphics.

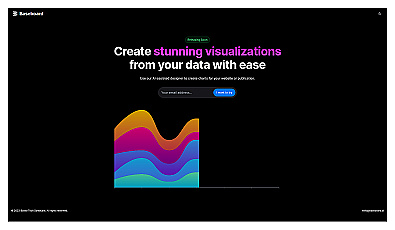
Create stunning charts from data with ease and speed.

Create engaging charts effortlessly from your data.
Transform complex data into clear and engaging visuals.
Visual data analytics and workflow automation for all users.
Open-source logging and visualization for AI data management.
A framework for scientific computing and machine learning.

Create engaging and interactive charts for data visualization.

Interactive data visualization components for clear insights.
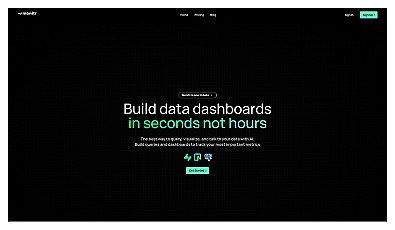
Create custom data dashboards without any coding required.
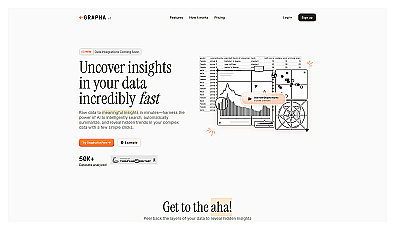
AI-powered data exploration and visualization platform.

Visualize and analyze data from multiple sources seamlessly.
User-friendly data analytics for quick insights and collaboration.

AI-driven data visualization and SQL query automation.

Transform data into visual charts using natural language commands.
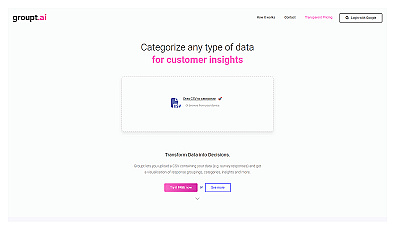
Streamlined data categorization and visualization for insightful analysis.

Create engaging visual reports and dashboards with ease.
Visualize data effortlessly with natural language insights.
Visualize and share data insights with ease.

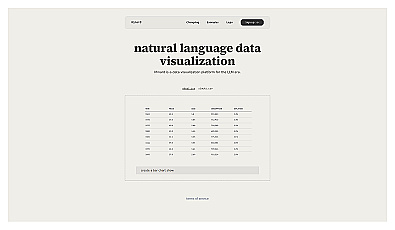
Natural language data visualization for better insights.

Automated data visualization generator for clear infographics.