Charting Systems Tools
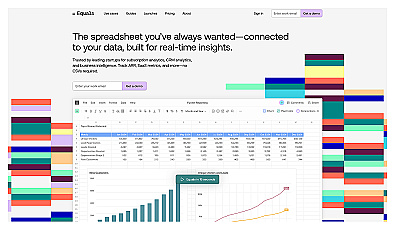
Connected spreadsheet for real-time data integration and analysis.

Visualize data to uncover insights and support decision-making.
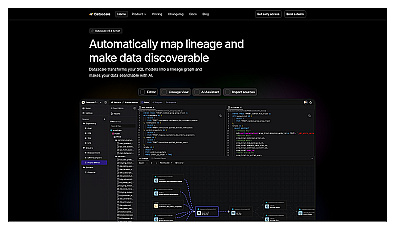
Visualizes SQL data relationships for improved discoverability.
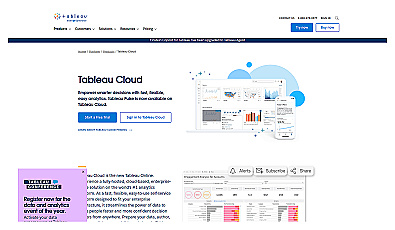
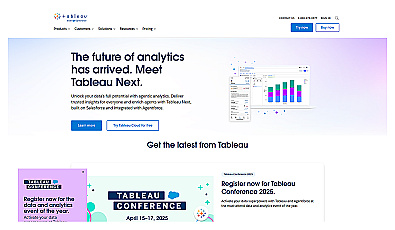
Cloud-based analytics for data visualization and collaboration.
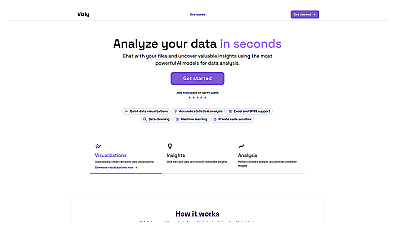
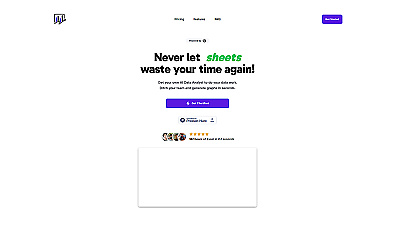
Transform complex data into clear insights in seconds.

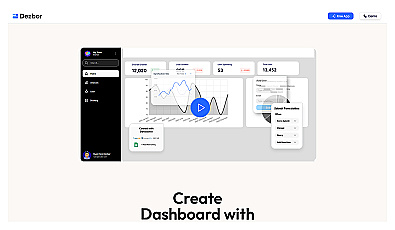
Create custom data dashboards without any coding required.

Create engaging visual reports and dashboards with ease.
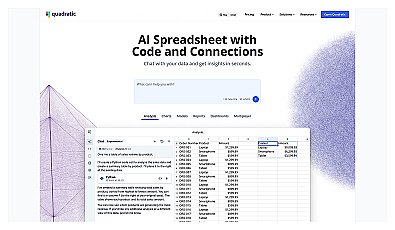
AI-driven spreadsheet tool for effortless data insights and analysis.
Visual data representation for informed decision-making.
AI-powered data analysis and visualization tool.

Build interactive web applications from Python scripts effortlessly.
Create various customizable charts for visual data representation.
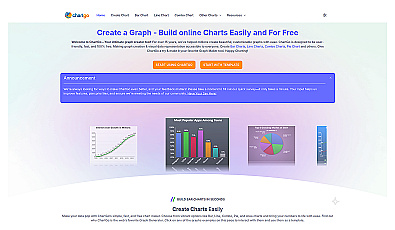
Create various types of charts from data effortlessly.

Interactive charts and maps for data visualization.

Create stunning charts from data with ease and speed.

Create engaging charts effortlessly from your data.

Create engaging and interactive charts for data visualization.

Interactive data visualization components for clear insights.
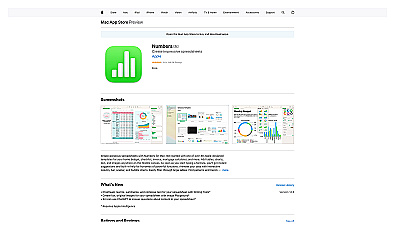
Create stunning spreadsheets with ease using intuitive design features.

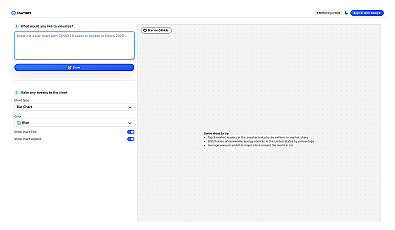
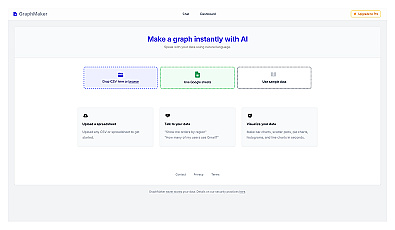
Transform data into visual charts using natural language commands.