User-Friendly Visualizations Tools

Create stunning graphs from raw data effortlessly.
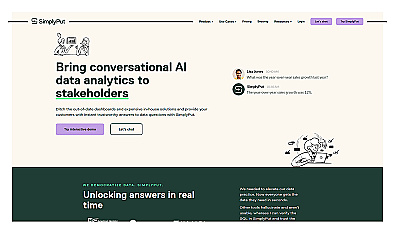
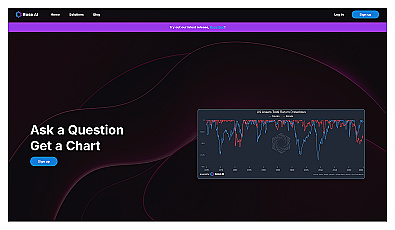
Ask questions about data and get instant, clear answers.
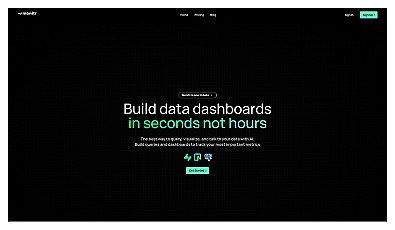
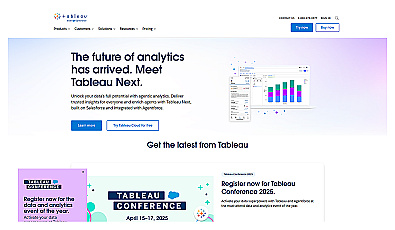
Transform complex data into clear visuals and insights.
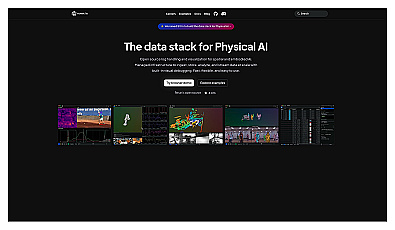
Open-source logging and visualization for AI data management.
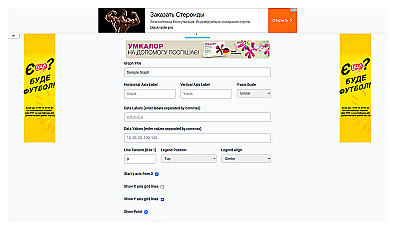
Create professional line charts to visualize data trends easily.

Create engaging and interactive charts for data visualization.

Interactive data visualization components for clear insights.
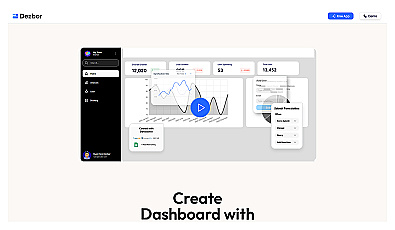
Create custom data dashboards without any coding required.

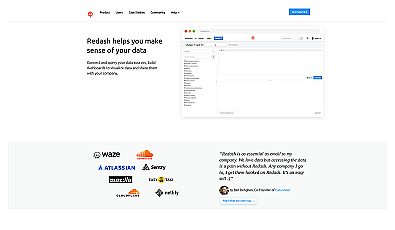
Visualize and analyze data from multiple sources seamlessly.
User-friendly data analytics for quick insights and collaboration.
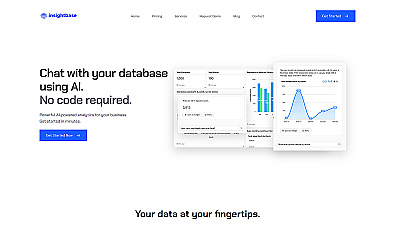
Transform database queries into simple, conversational insights.

AI-driven data visualization and SQL query automation.

Transform data into visual charts using natural language commands.

Create engaging visual reports and dashboards with ease.
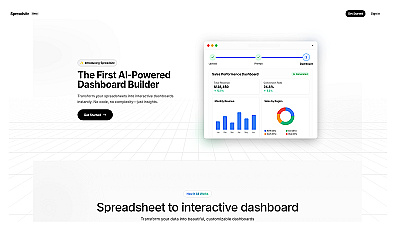
Transform spreadsheets into interactive dashboards effortlessly.
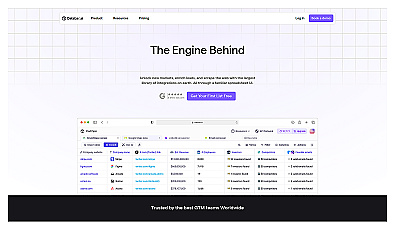
Automated data collection and enrichment for informed decision-making.
Visualize data effortlessly with natural language insights.
Visual data representation for informed decision-making.
Visualize and share data insights with ease.
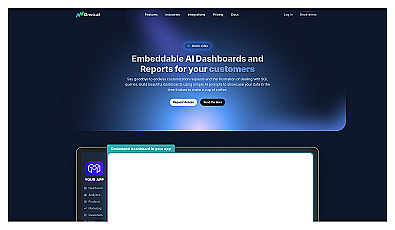
Create dashboards and reports effortlessly with AI prompts.
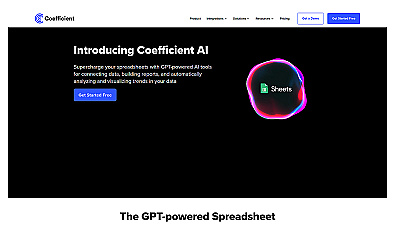
AI-driven spreadsheet enhancement for automated data analysis.

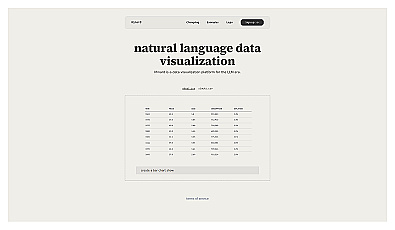
Natural language data visualization for better insights.

Create clear visuals from complex data effortlessly.
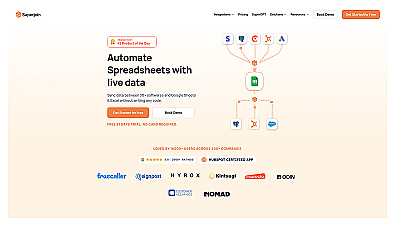
Connects multiple data sources to spreadsheets effortlessly.

Automated data visualization generator for clear infographics.