Visualization Automation Tools

AI-driven data visualization and SQL query automation.

Transform data into visual charts using natural language commands.

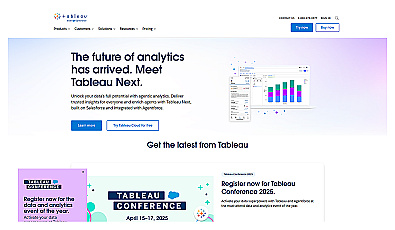
Create engaging visual reports and dashboards with ease.
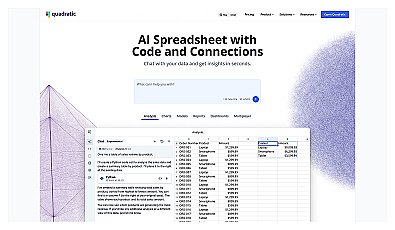
AI-driven spreadsheet tool for effortless data insights and analysis.
Visualize data effortlessly with natural language insights.
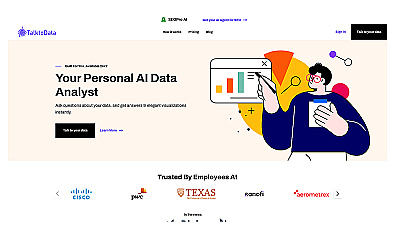
AI-powered data analysis and visualization tool.
Visualize and share data insights with ease.
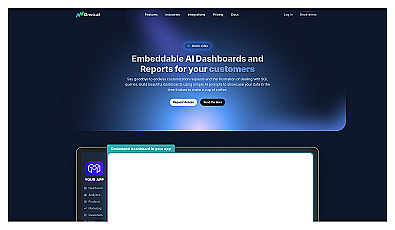
Create dashboards and reports effortlessly with AI prompts.
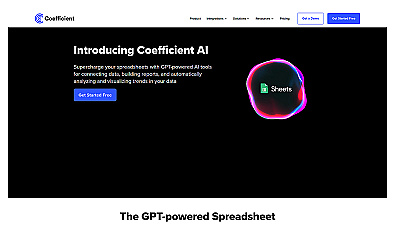
AI-driven spreadsheet enhancement for automated data analysis.

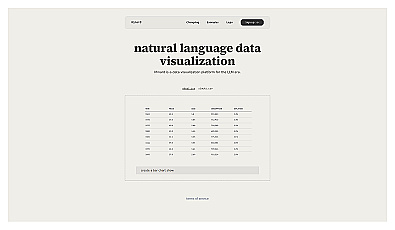
Natural language data visualization for better insights.

Visualize data to uncover insights and support decision-making.

Create engaging charts effortlessly from your data.

Create stunning graphs from raw data effortlessly.
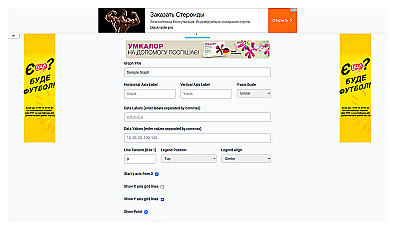
Create professional line charts to visualize data trends easily.

Interactive data visualization components for clear insights.
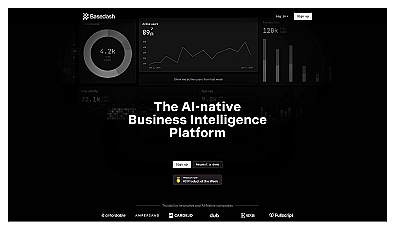
Visual data representation for informed decision-making.

Visualize and analyze your data with ease and clarity.
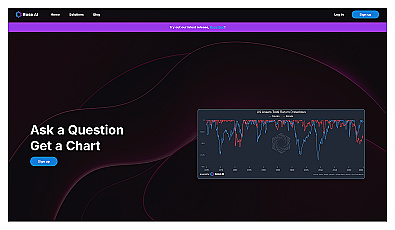
Visualize data insights through natural language queries.
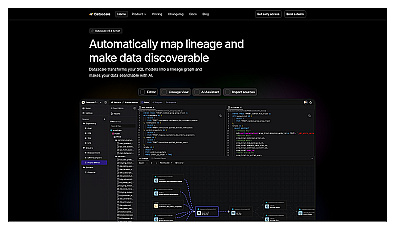
Visualizes SQL data relationships for improved discoverability.
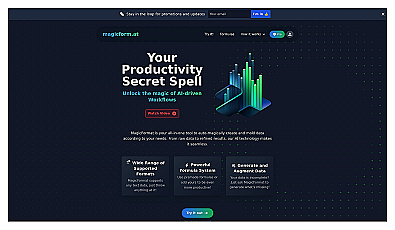
Transform raw data into polished formats effortlessly.
Programming environment for numerical computing and data analysis.
Spatial data visualization and analysis for informed decision-making.
Automatically extracts and organizes data from websites easily.
Transform complex data into clear visuals and insights.