Visual Data Presentation Tools
Create stunning presentations with ease and collaboration.

Natural language data visualization for better insights.
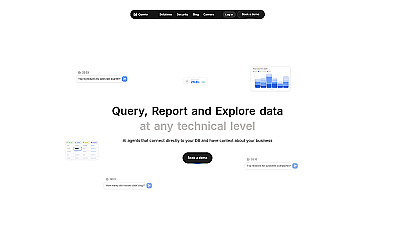
Natural language data exploration for informed decision-making.
Predictive analytics for informed resource management and planning.
Generate insightful reports and visuals in moments with AI support.
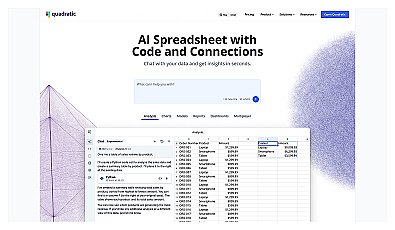
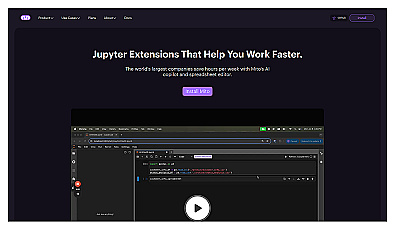
AI-driven spreadsheet tool for effortless data insights and analysis.
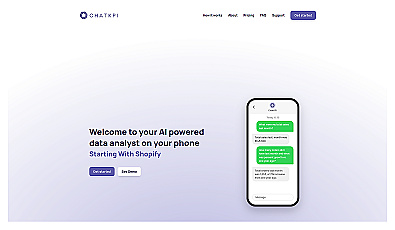
A real-time data analyst for your Shopify store.
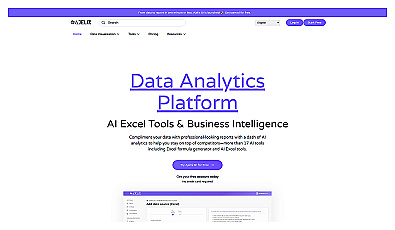
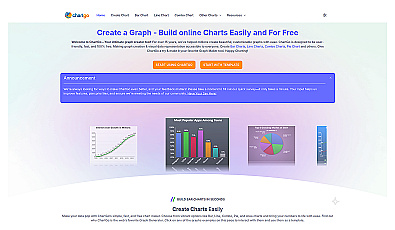
Create various types of charts from data effortlessly.
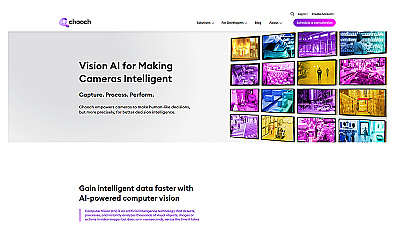
Real-time image and video analysis for smarter decision-making.
Visualize data insights through intuitive and clear graphics.
Advanced image analysis and text extraction for various industries.

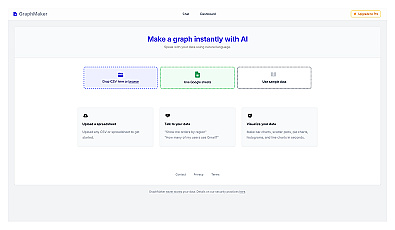
Create stunning graphs from raw data effortlessly.
Automated imaging for actionable insights across industries.

Transform data into visual charts using natural language commands.
Create various customizable charts for visual data representation.

Create clear visuals from complex data effortlessly.
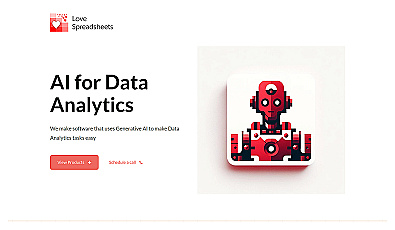
Automated data analysis using Generative AI for everyone.
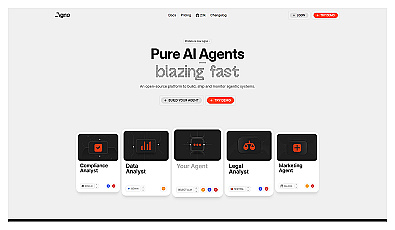
Build and manage adaptable AI agents for various tasks.
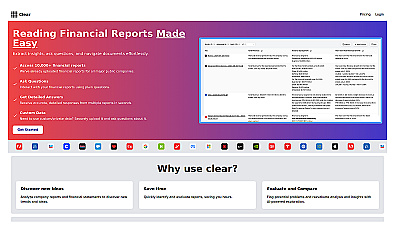
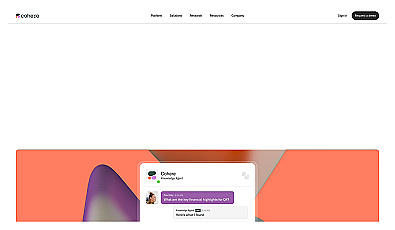
Quickly analyze financial reports with plain language queries.
Visual analytics tool for creating insightful reports and dashboards.
Automates spreadsheet creation and generates Python code seamlessly.

Advanced translation services blending AI and human expertise.
AI-driven text generation and document analysis for enterprises.
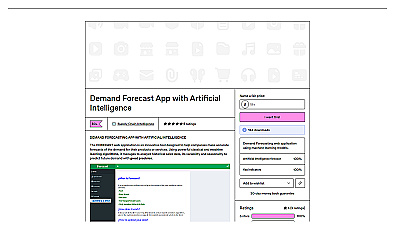
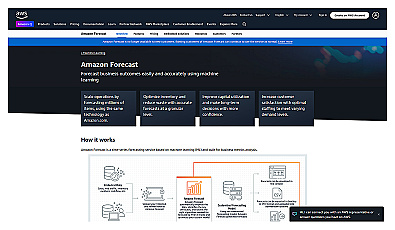
AI-driven tool for accurate demand predictions and inventory management.
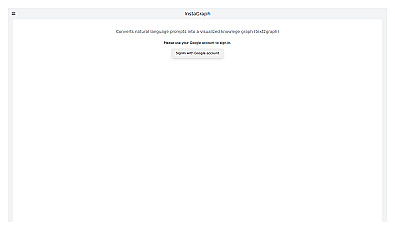
Visualize knowledge and relationships through dynamic graphs.