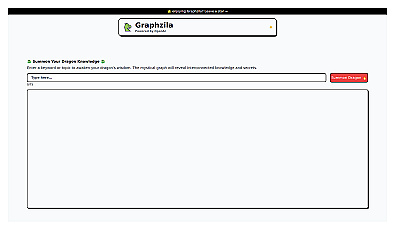
Graphzila
Visualize connections between concepts for deeper understanding.
Visualize knowledge and relationships through dynamic graphs.
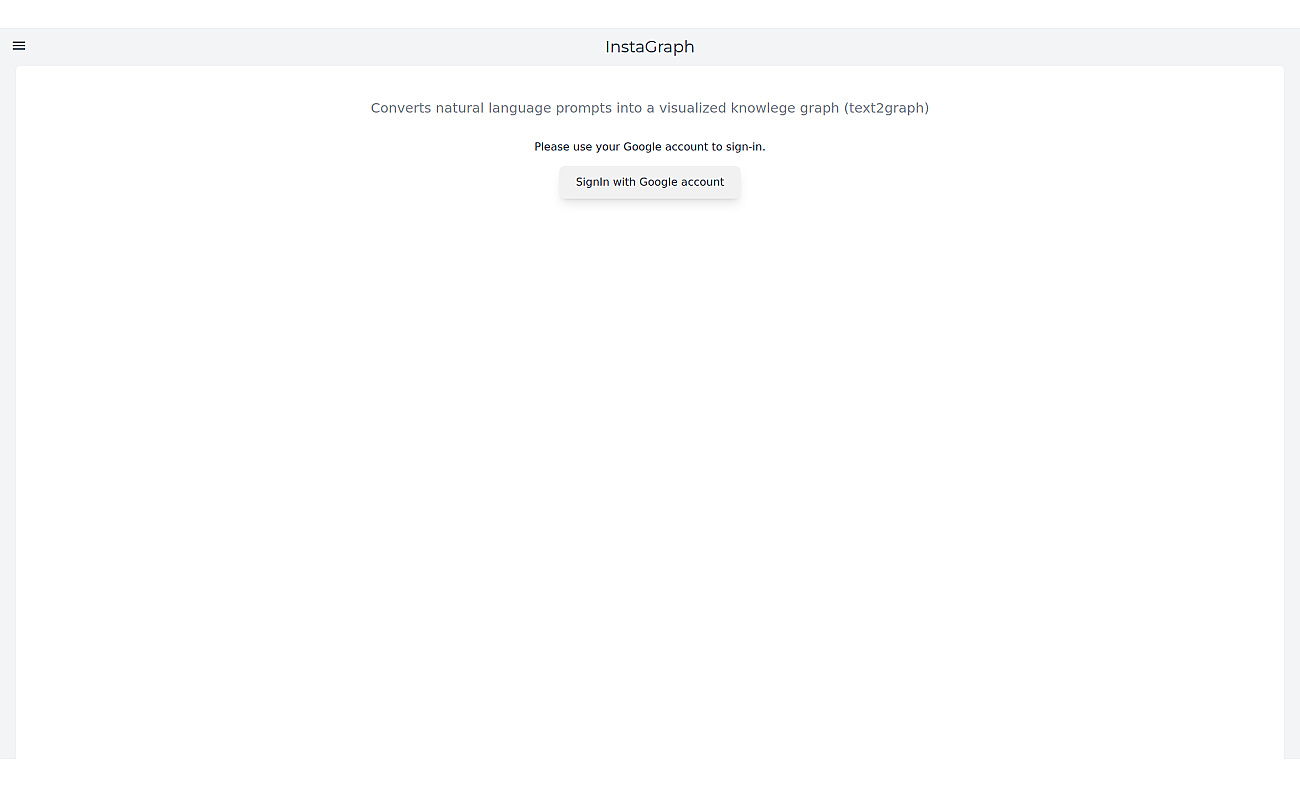
InstaGraph transforms text into visual graphs that display connections between ideas and information. This product allows users to input natural language prompts, which are then turned into easy-to-understand graphs.
It's designed for students, researchers, and anyone working with large amounts of data. By providing a visual representation of complex concepts, InstaGraph makes it easier to analyze relationships and communicate information effectively. Users can sign in using their Google accounts for quick access.
This approach supports collaborative efforts and enhances the understanding of various topics, making it useful for creating infographics, summarizing notes, and mapping out project ideas.
Based on overlapping tasks and related categories.
Visualize connections between concepts for deeper understanding.
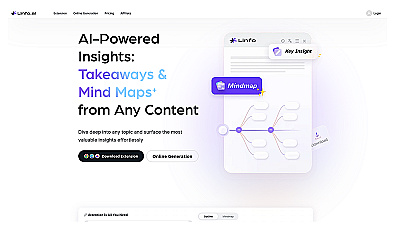
Summarizes complex content into clear insights and organized takeaways.
Visual tool for organizing ideas and planning projects effectively.
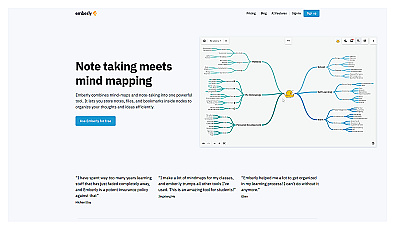
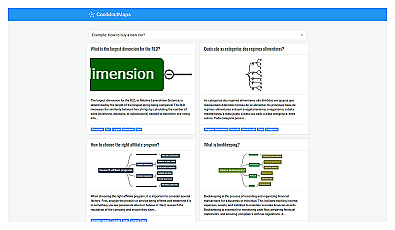
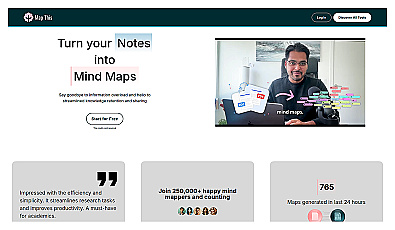
Visual note-taking and mind mapping for effective learning.

Create clear visuals from complex data effortlessly.
Transform PDFs into visual mind maps for better understanding.
Discover other similar tools and compare features