Visual Data Exploration Tools

Create clear visuals from complex data effortlessly.

Instantly analyze screenshots for smart insights and solutions.
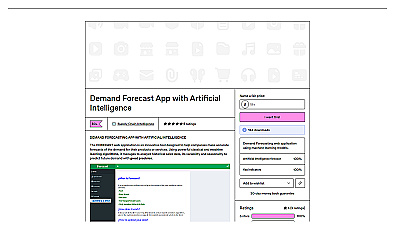
AI-driven tool for accurate demand predictions and inventory management.
Visualize knowledge and relationships through dynamic graphs.

Efficient document analysis and collaborative writing assistant.
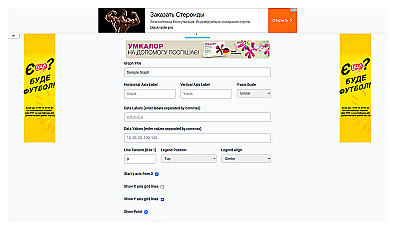
Create professional line charts to visualize data trends easily.
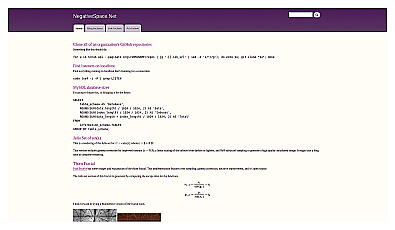
Practical coding guides and scripts for data management and graphics.
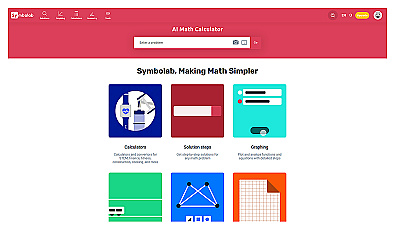
Step-by-step math problem solver with visual aids.

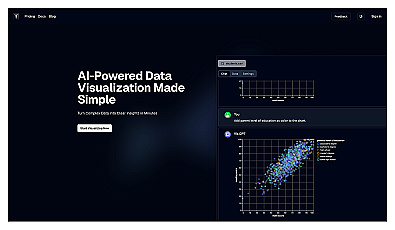
AI-powered data analysis and visualization tool.
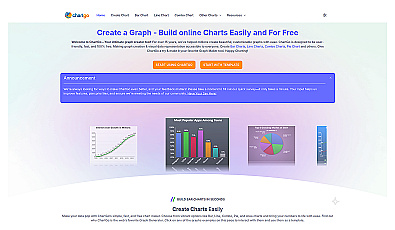
Create various customizable charts for visual data representation.
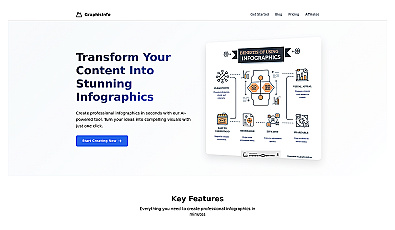
Create stunning infographics quickly with AI-powered design.
Intuitive data analysis for insightful decision-making.

Visualize data to uncover insights and support decision-making.

Transforms data into engaging visual reports for better insights.
Transform complex data into clear visual insights effortlessly.
Transform complex data into clear and engaging visuals.

Create engaging and interactive charts for data visualization.

Create stunning graphs from raw data effortlessly.