Interactive Charts Tools

Interactive data visualization components for clear insights.

Create clear visuals from complex data effortlessly.

Automated data visualization generator for clear infographics.
Framework for building dynamic neural networks and computations.
Integrated database management for real-time data applications.
Privacy-focused analytics for large datasets without risk.
AI-powered assistance for Microsoft Excel tasks.
Access extensive multilingual image-text datasets for machine learning.
Learn SQL through engaging tutorials and practical exercises.
Data management and labeling solution for AI applications.
Comprehensive cloud computing solutions for businesses.
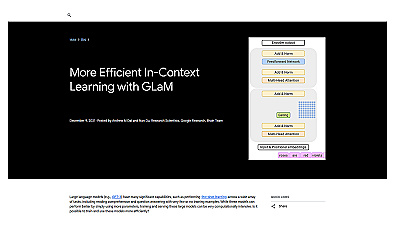
Efficient language model utilizing a mixture of experts approach.
Reliable cloud storage for data management and accessibility.
Generative AI integration for fast application development and insights.
Centralized management for data science projects and collaboration.

Create interactive web applications directly from Python scripts.
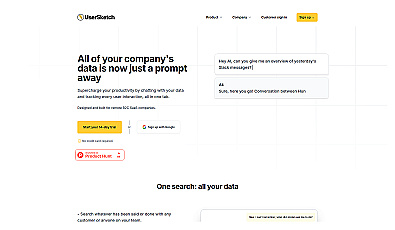
Natural language data exploration for informed decision-making.
Create various types of charts from data effortlessly.
Transform complex data into clear visual insights effortlessly.
Visualize data trends with automatic chart generation.

Interactive charts and maps for data visualization.
Streamlined data management and communication for businesses.
Visualize data insights through intuitive and clear graphics.

Create stunning charts from data with ease and speed.

Create engaging charts effortlessly from your data.