Data Visualization And Reporting Tools Tools
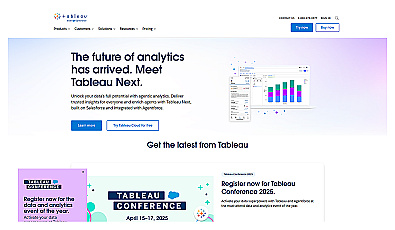
Transform complex data into clear visual insights effortlessly.
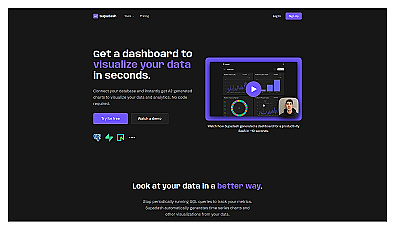
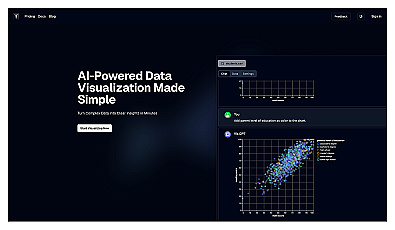
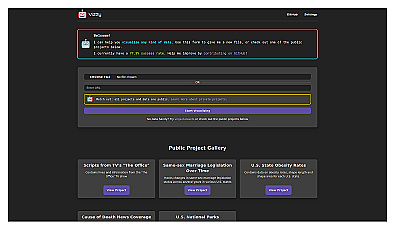
Visualize data trends with automatic chart generation.
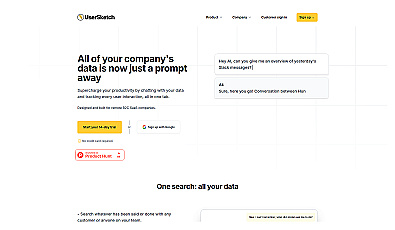
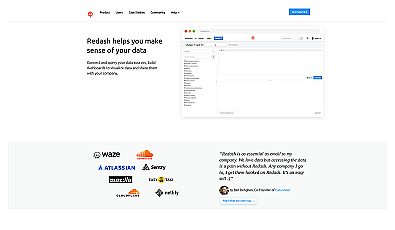
Streamlined data management and communication for businesses.
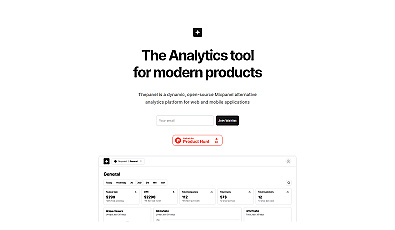
Comprehensive analytics for web and mobile applications.
Visualize data insights through intuitive and clear graphics.
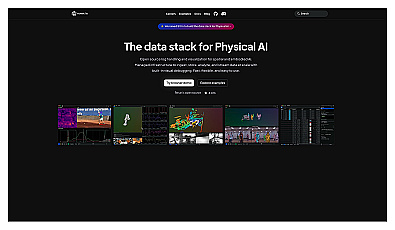
Open-source logging and visualization for AI data management.

Visualize and analyze data from multiple sources seamlessly.
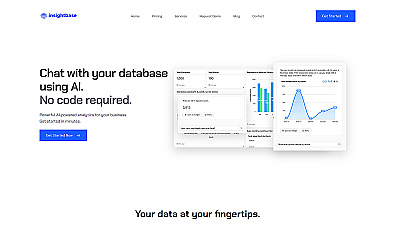
Transform database queries into simple, conversational insights.

Transform data into visual charts using natural language commands.
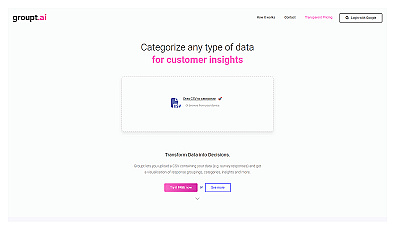
Streamlined data categorization and visualization for insightful analysis.

Create engaging visual reports and dashboards with ease.
Visual data representation for informed decision-making.
Visualize and share data insights with ease.
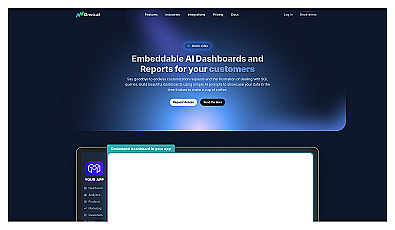
Create dashboards and reports effortlessly with AI prompts.
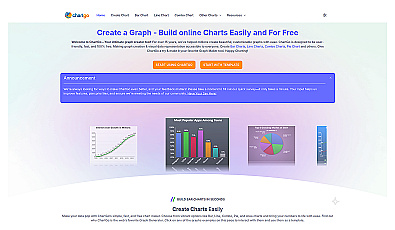
Create various customizable charts for visual data representation.

Natural language data visualization for better insights.