Visual Data Accessibility Tools
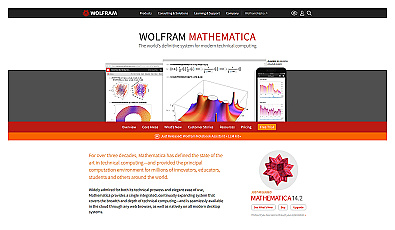
Advanced environment for mathematical computing and data visualization.
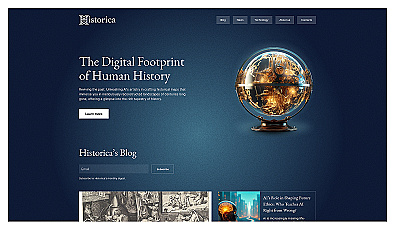
Explore history through detailed, interactive maps.
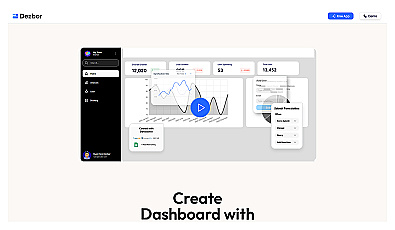
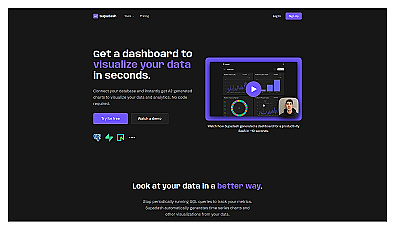
Create custom data dashboards without any coding required.
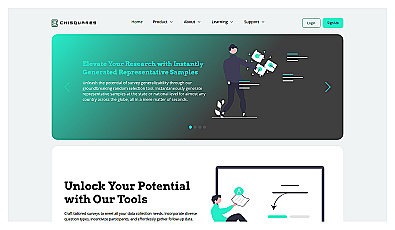
Generate quick, representative survey samples for research projects.
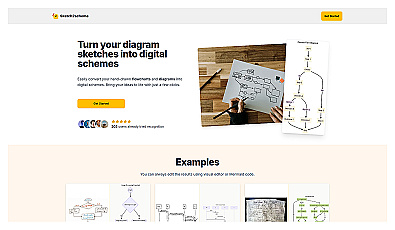
Transform sketches into polished digital diagrams effortlessly.
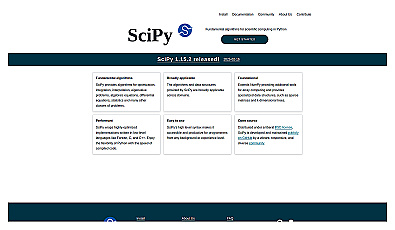
Library for scientific computing with algorithms in Python.

AI-generated visuals that creatively interpret your surroundings.
User-friendly interface for designing advanced diffusion models.
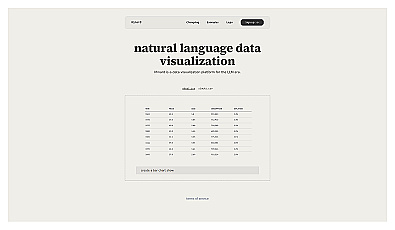
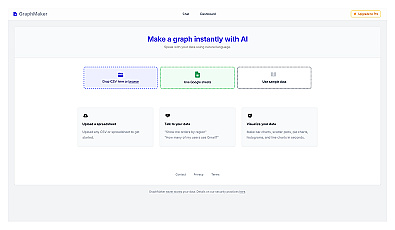
Visualize data effortlessly with natural language insights.
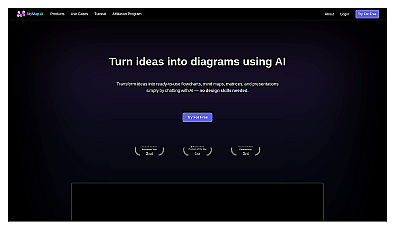
Visualize ideas and concepts effortlessly with intelligent diagrams.
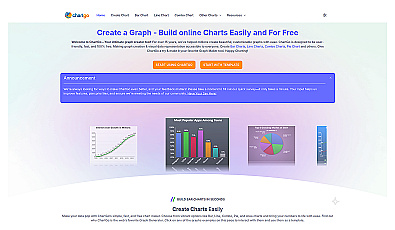
Create various customizable charts for visual data representation.

Create clear visuals from complex data effortlessly.
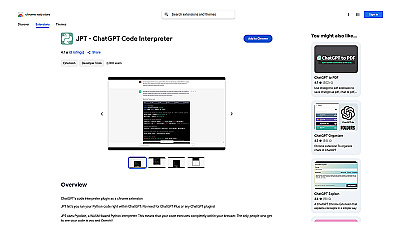
Instantly run Python code directly in your browser.

Automated data visualization generator for clear infographics.
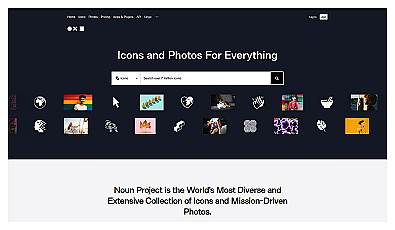
A comprehensive resource for icons and stock images.
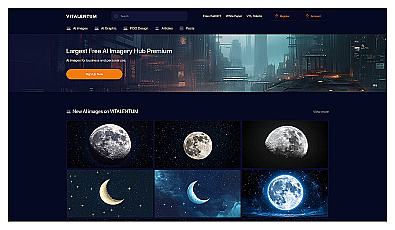
Create stunning visuals with AI-generated images and free photos.

Instant image generation for social media and marketing needs.

Create interactive web applications directly from Python scripts.
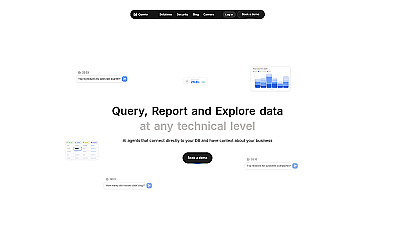
Natural language data exploration for informed decision-making.

Visualize data to uncover insights and support decision-making.
Create various types of charts from data effortlessly.
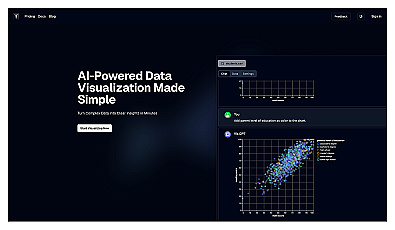
Transform complex data into clear visual insights effortlessly.
Visualize data trends with automatic chart generation.

Interactive charts and maps for data visualization.
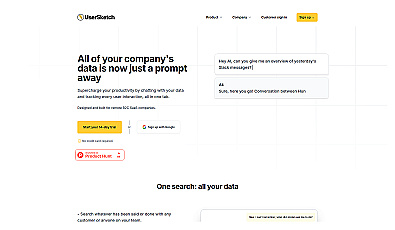
Streamlined data management and communication for businesses.