Data Visualization For Analysis Tools

AI-driven image analysis for clear and detailed descriptions.
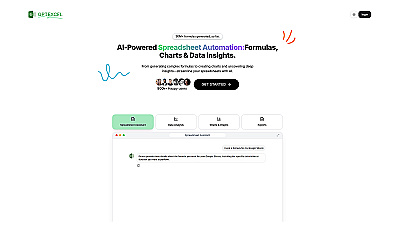
AI-driven solution for managing spreadsheets and data analysis.
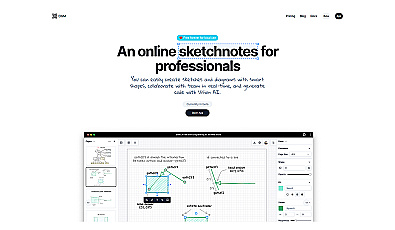
Create interactive sketchnotes and diagrams seamlessly.
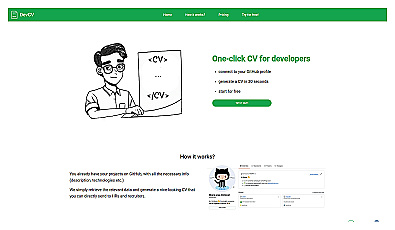
Generate professional CVs from GitHub profiles effortlessly.
Research management and organization for academic success.
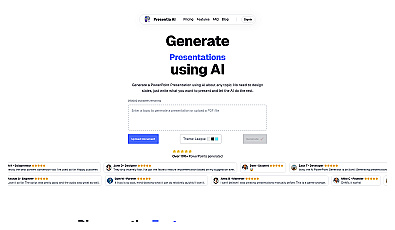
Create professional presentations in seconds with AI-driven assistance.
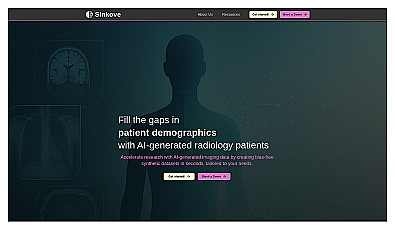
AI-generated imaging datasets for disease research and treatment development.
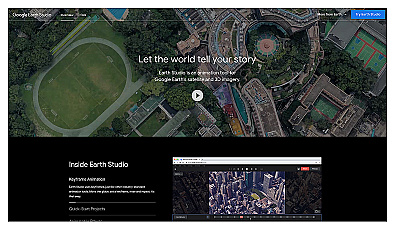
Create stunning animations using satellite imagery.
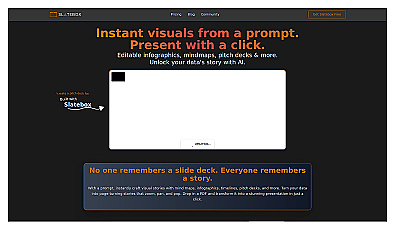
Create engaging visuals from data for presentations.
Visualize knowledge and relationships through dynamic graphs.
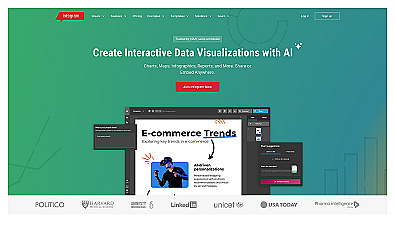
Create engaging interactive data visualizations effortlessly.
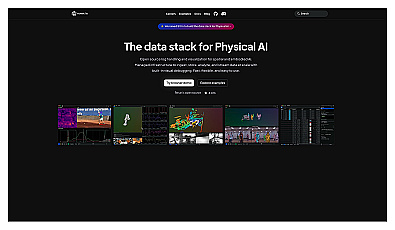
Open-source logging and visualization for AI data management.
Capture detailed 3D models using your smartphone effortlessly.
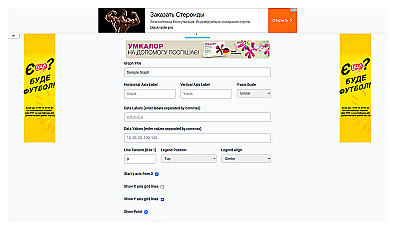
Create professional line charts to visualize data trends easily.
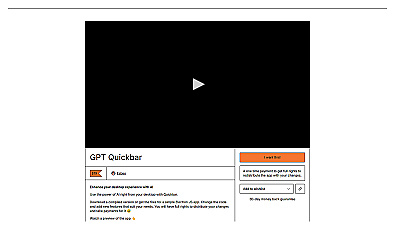
Integrate AI functionality directly into your desktop experience.

Interactive data visualization components for clear insights.

Create interactive web applications for data visualization.
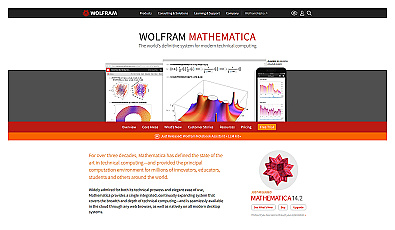
Advanced environment for mathematical computing and data visualization.
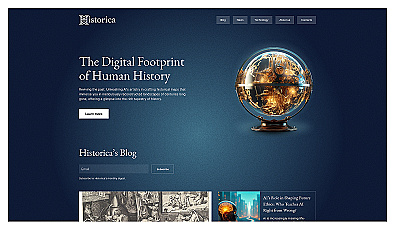
Explore history through detailed, interactive maps.
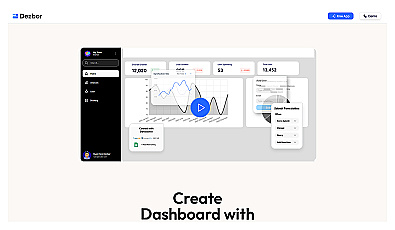
Create custom data dashboards without any coding required.
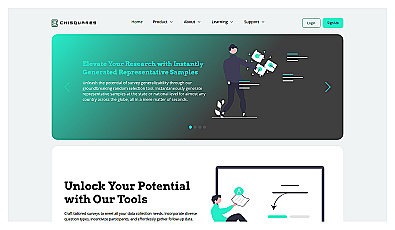
Generate quick, representative survey samples for research projects.
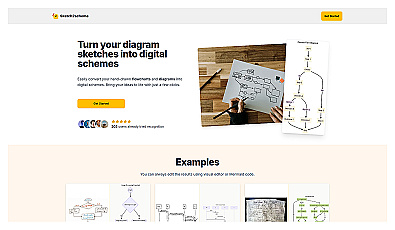
Transform sketches into polished digital diagrams effortlessly.
Library for scientific computing with algorithms in Python.
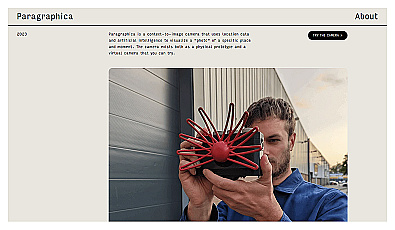
AI-generated visuals that creatively interpret your surroundings.