Data Visualization Tools
Interactive data analysis with AI-driven insights and visualizations.
AI-driven solution for streamlined post-call workflows.
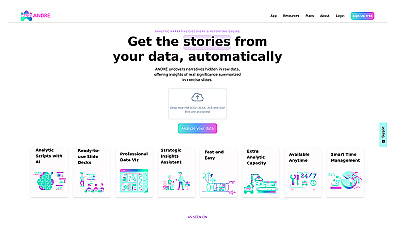
Market analysis tool that uncovers trends and insights.

Streamlined AI for efficient spreadsheet management and analysis.
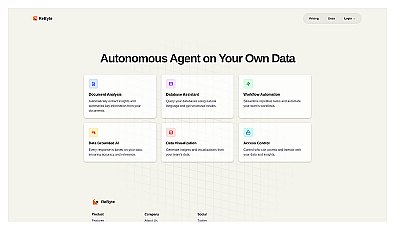
AI-driven applications for enhanced operational efficiency and insights.
Visual storytelling tool for clear data communication.
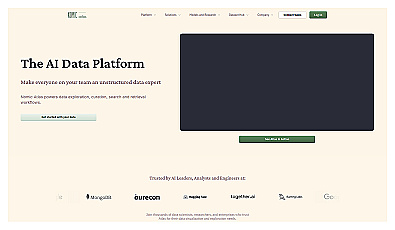
Visualizes and curates data for collaborative analysis and insights.
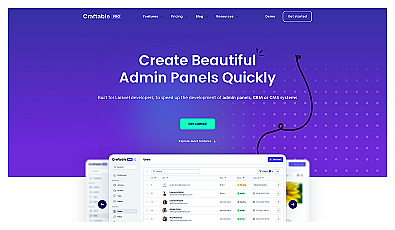
Quickly creates user-friendly admin interfaces for developers.
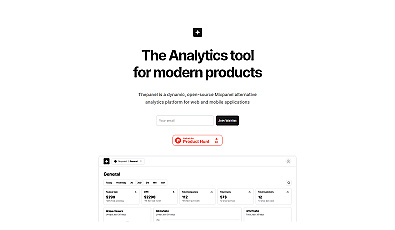
Comprehensive analytics for web and mobile applications.

Advanced analytics for strategic decision-making and data visualization.
Automates data analysis and workflow for better insights.
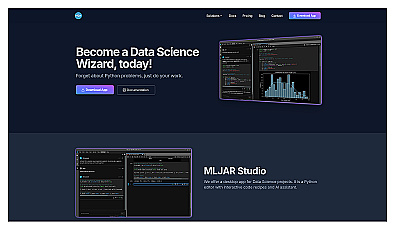
Interactive coding environment for data science and machine learning.
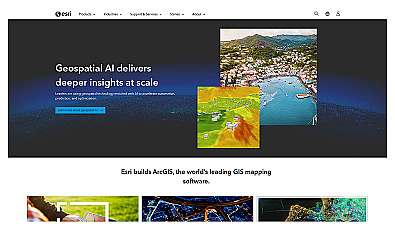
Spatial data visualization and analysis for informed decision-making.
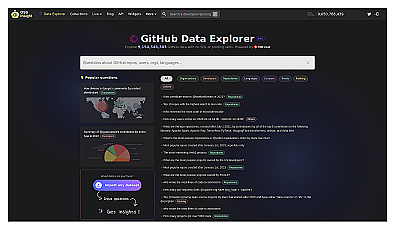
Explore GitHub data with AI-driven queries and visual insights.
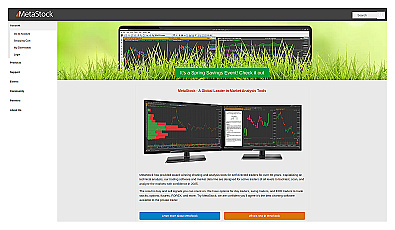
Advanced market analysis and charting for traders of all levels.

Streamlined data analysis for collaborative insights.
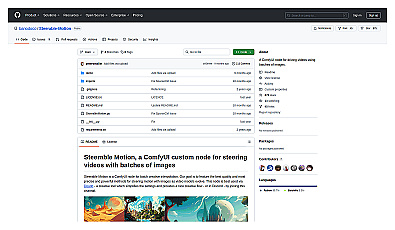
Create engaging animations from batches of images effortlessly.
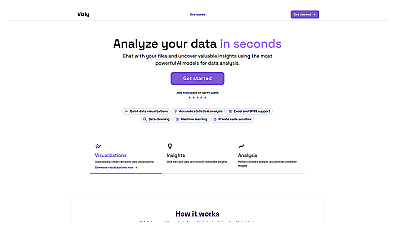
Transform complex data into clear insights in seconds.
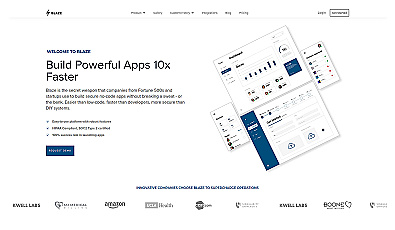
Build powerful applications without any coding knowledge.
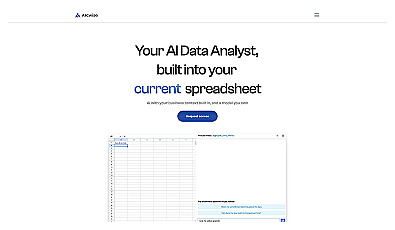
AI-driven insights for spreadsheet users to enhance data analysis.
Data analysis made easy for everyone, regardless of experience.
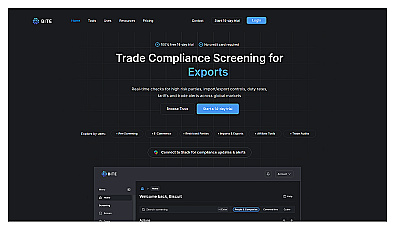
Advanced compliance monitoring for trade risk management.

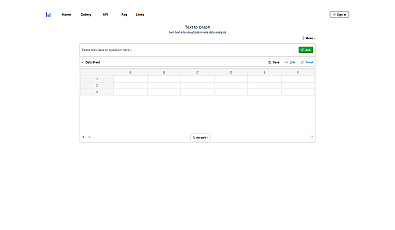
Create stunning graphs from raw data effortlessly.
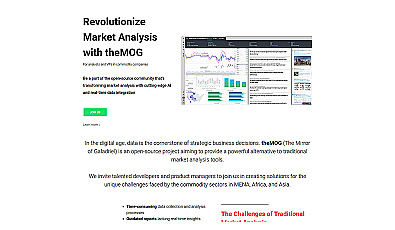
AI-driven market analysis for commodities in MENA, Africa, and Asia.

AI-driven insights for efficient stock research and investment decisions.