OSS Insight

OSS Insight

Explore GitHub data with AI-driven queries and visual insights.

Visit Website
OSS Insight screenshot

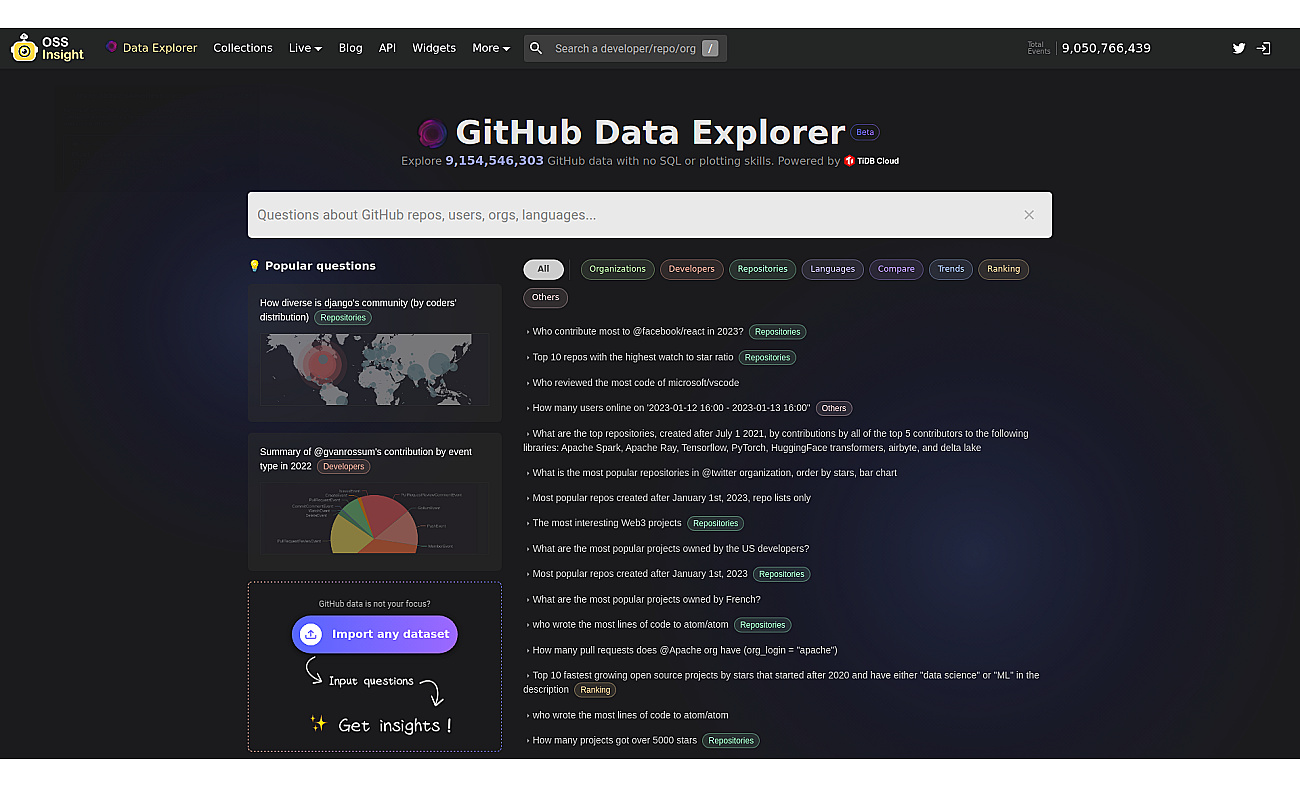
OSS Insight provides an intuitive way to analyze GitHub data. This allows users to explore event data without needing SQL skills.

AI translates simple questions into SQL queries, making data exploration accessible to everyone. Results are displayed through clear visualizations, helping users understand trends and community insights. Users can analyze large datasets, track contributions, and benchmark performance without feeling overwhelmed.

OSS Insight serves various purposes, from monitoring developer activity to visualizing repository popularity and assessing project engagement. This makes it a valuable resource for anyone interested in understanding open-source projects and their communities.


  • Analyze contributions to open-source projects
  • Track developer activity over time
  • Visualize trends in repository popularity
  • Explore community diversity metrics
  • Identify top contributors in a project
  • Compare programming languages usage
  • Monitor pull request trends
  • Assess project engagement metrics
  • Investigate user behavior patterns
  • Benchmark performance of repositories
  • User-friendly interface for non-technical users
  • AI-generated SQL queries streamline data exploration
  • Visualizations make data easy to understand
  • Supports analysis of large datasets
  • Allows exploration of custom datasets easily


Tableau

Visual data representation for informed decision-making.

Subscription + from $15/user/m
open
Thepanel

Comprehensive analytics for web and mobile applications.

Sloped

Transforms data exploration into an intuitive search experience.

AskCSV

Upload CSV files and ask questions to analyze data easily.

Vizly

Transform complex data into clear insights in seconds.

ChartPixel

Intuitive data analysis for insightful decision-making.

Athenic AI

Natural language interface for quick data analysis and insights.

ChatCSV

Natural language data visualization for better insights.

Product info