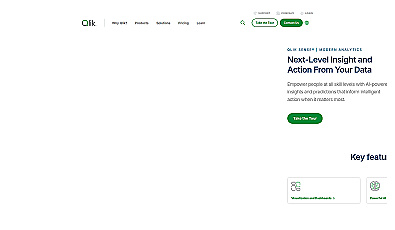
Qlik Sense
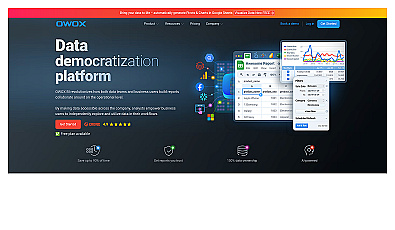
Visual analytics tool for creating insightful reports and dashboards.
Free
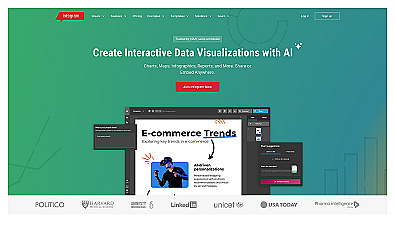
Create engaging interactive data visualizations effortlessly.
Infogram is a resource for producing interactive graphics and visual content. It enables users to…
Read more
Visual analytics tool for creating insightful reports and dashboards.
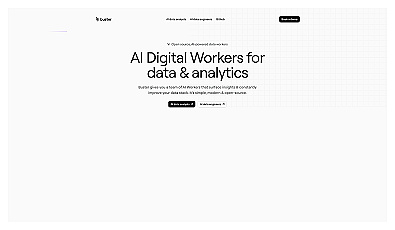
AI-driven data workers simplify data querying for everyone.
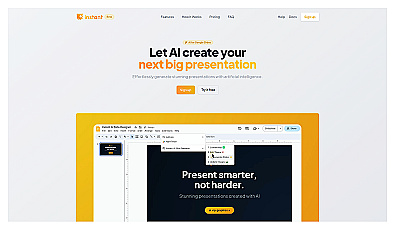
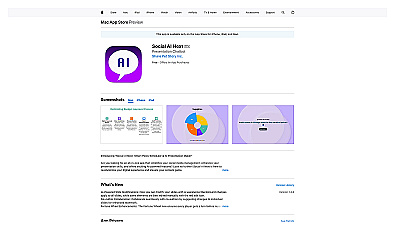
Generate stunning presentations with intelligent design assistance.
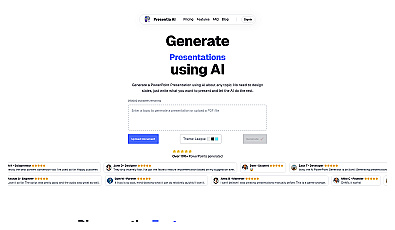
Create professional presentations in seconds with AI-driven assistance.
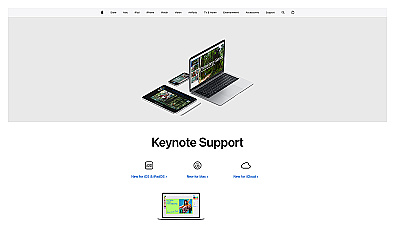
Create stunning presentations with ease and collaboration.
Transform concepts and text into engaging visuals effortlessly.
Create stunning visual stories for social media effortlessly.

Create stunning graphs from raw data effortlessly.
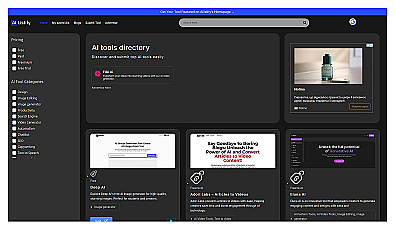
Discover a curated directory of AI resources for various needs.
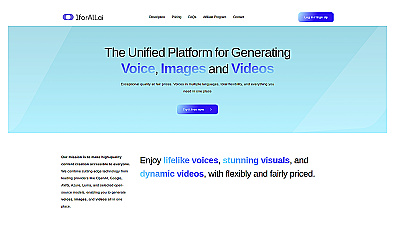
Create voices, images, and videos all in one place.
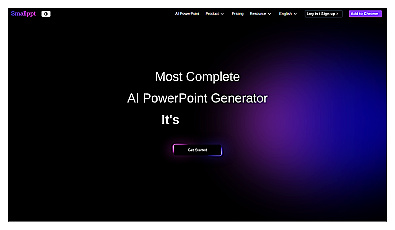
Create professional presentations in minutes with AI-generated slides.
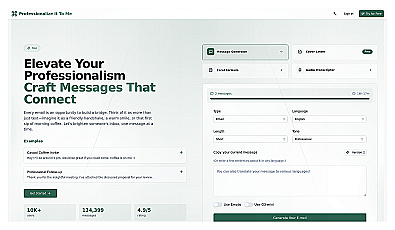
Generate professional text and complex Excel formulas effortlessly.
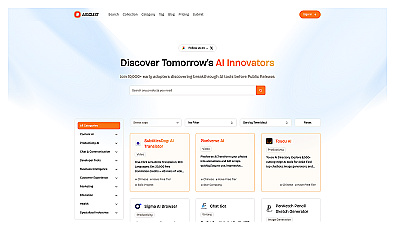
Discover innovative AI solutions before their public release.
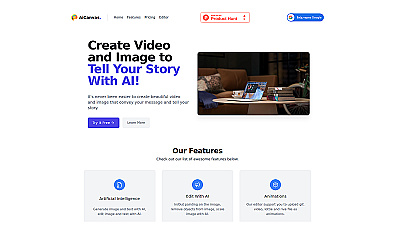
Create stunning images and videos with artificial intelligence.

Create stunning visuals for presentations, infographics, and more.
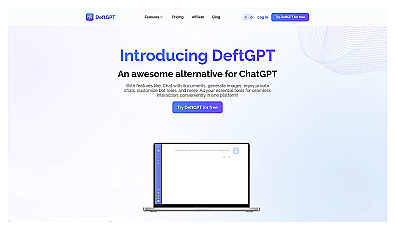
Engage in seamless conversations with documents and images.
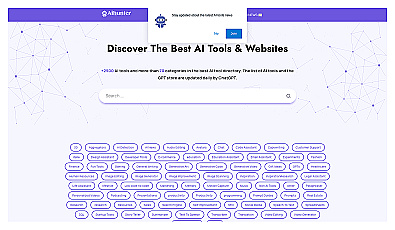
Explore a vast collection of AI-driven resources and applications.
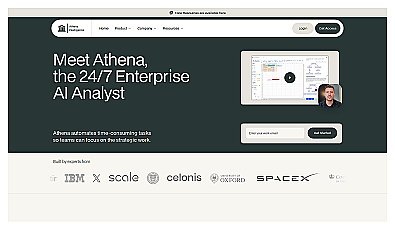
AI-driven analytics for efficient data insights and task automation.
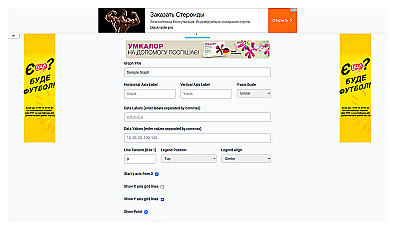
Create professional line charts to visualize data trends easily.
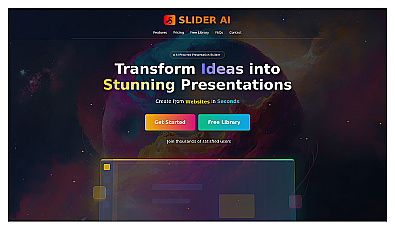
Create stunning presentations in seconds with AI-driven design.
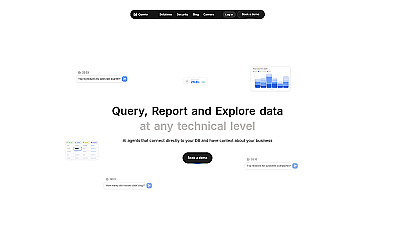
Natural language data exploration for informed decision-making.
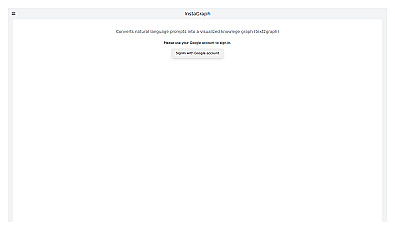
Visualize knowledge and relationships through dynamic graphs.
Streamlines data visualization and reporting in Google Sheets.