Data Visualization For Reporting Tools
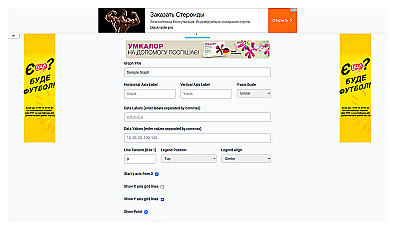
Create professional line charts to visualize data trends easily.
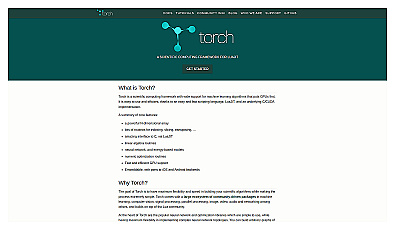
A framework for scientific computing and machine learning.

Create engaging and interactive charts for data visualization.

Interactive data visualization components for clear insights.
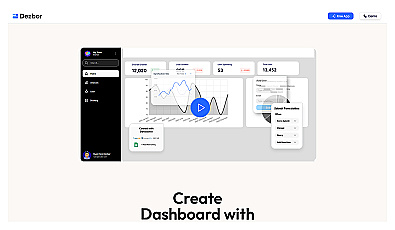
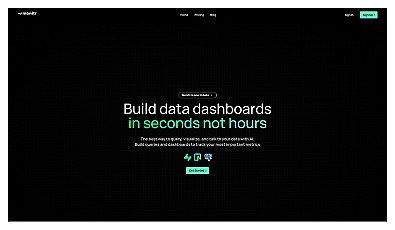
Create custom data dashboards without any coding required.
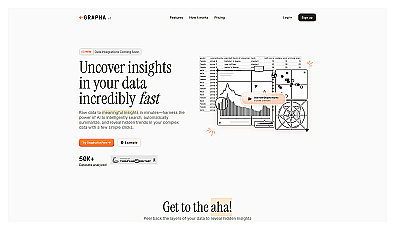
AI-powered data exploration and visualization platform.

Visualize and analyze data from multiple sources seamlessly.
User-friendly data analytics for quick insights and collaboration.

AI-driven data visualization and SQL query automation.
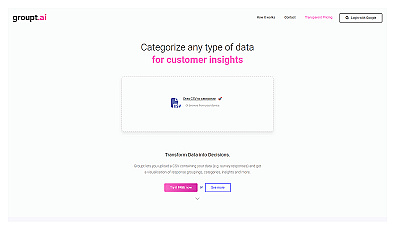
Streamlined data categorization and visualization for insightful analysis.

Create engaging visual reports and dashboards with ease.
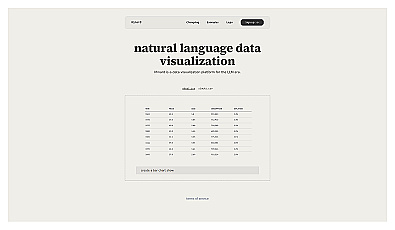
Visualize data effortlessly with natural language insights.
AI-powered data analysis and visualization tool.
Visualize and share data insights with ease.
Create various customizable charts for visual data representation.

Natural language data visualization for better insights.
Framework for building dynamic neural networks and computations.
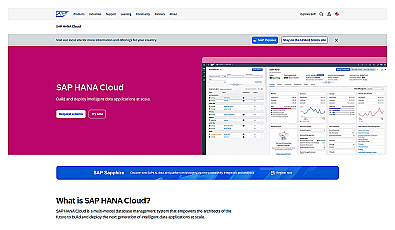
Integrated database management for real-time data applications.
Privacy-focused analytics for large datasets without risk.
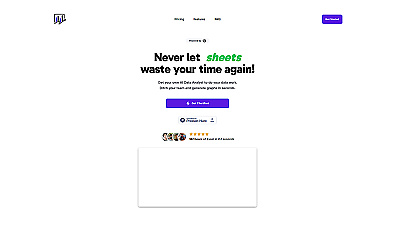
AI-powered assistance for Microsoft Excel tasks.
Access extensive multilingual image-text datasets for machine learning.
Learn SQL through engaging tutorials and practical exercises.
Data management and labeling solution for AI applications.
Comprehensive cloud computing solutions for businesses.
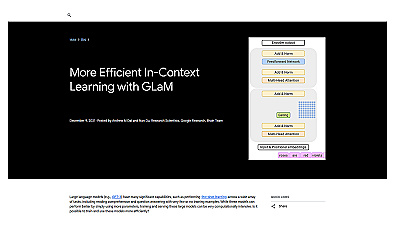
Efficient language model utilizing a mixture of experts approach.