Grafana
Visual analytics and monitoring for diverse data sources.
Comprehensive monitoring and analytics for software performance.
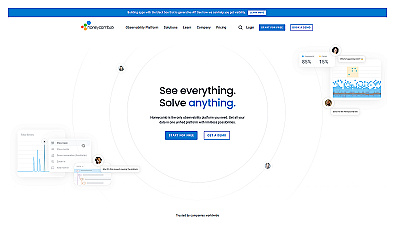
New Relic is a software monitoring and analytics solution designed to enhance visibility into application…
Read more
Visual analytics and monitoring for diverse data sources.
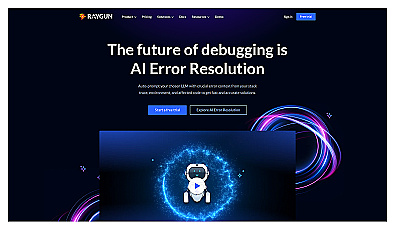
Real-time error tracking and application performance monitoring.
Analyze user interactions with AI chatbots for improved performance.
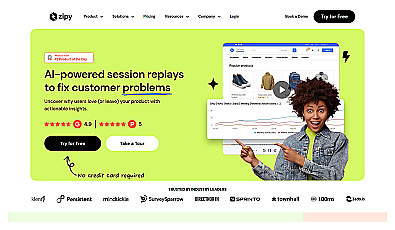
User session insights for optimizing web and app performance.
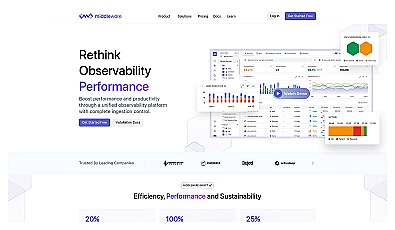
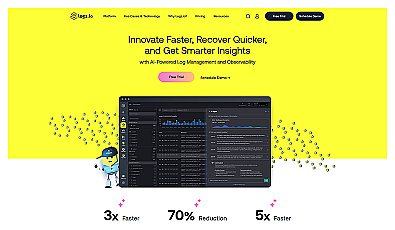
Unified observability for monitoring logs and application performance.
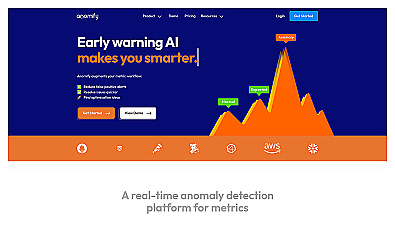
Real-time anomaly detection for operational reliability and performance.
Transform audio, video, or text into various content types quickly.
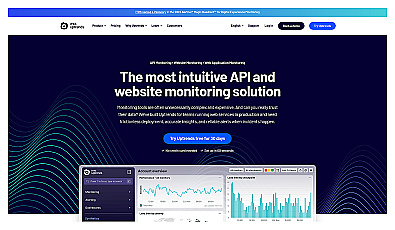
Monitor website and API performance with real-time alerts.
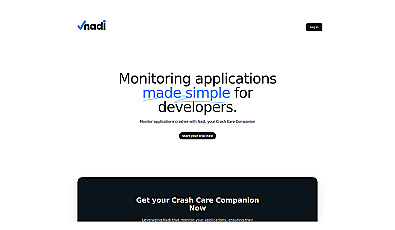
Real-time application performance monitoring and crash alerting.
Application performance monitoring and error tracking solution.
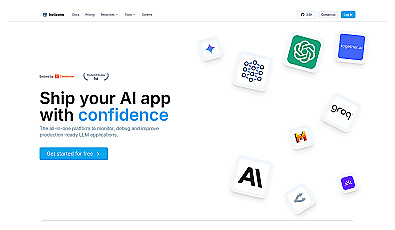
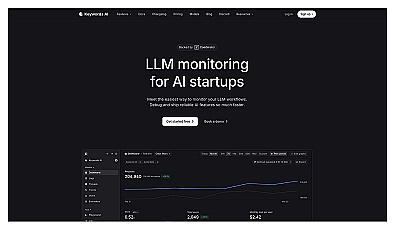
Monitor and debug large language model applications in real-time.
Unified observability data for application performance analysis.
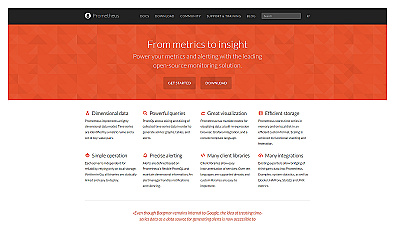
Open-source monitoring solution for system performance and health.
Streamlined performance monitoring for AI applications.
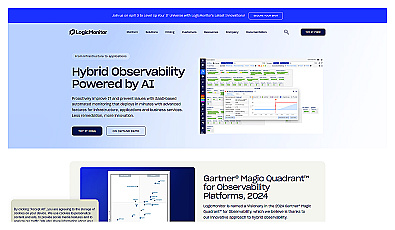
Real-time monitoring for IT infrastructure and applications.

Real-time feedback and engagement analytics for software usage.
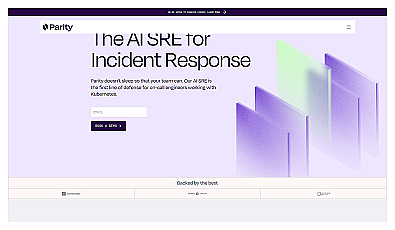
AI-driven incident response for Kubernetes environments.
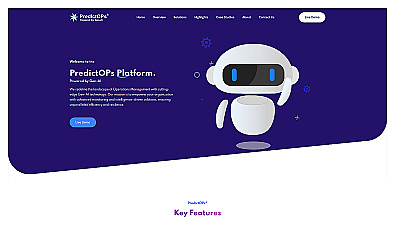
Generative AI-driven operations management for real-time insights.
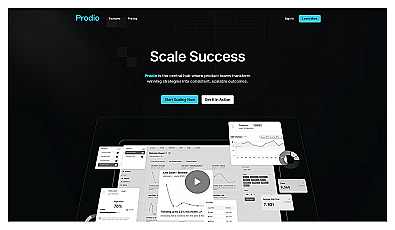
Central hub for streamlined product management and team collaboration.
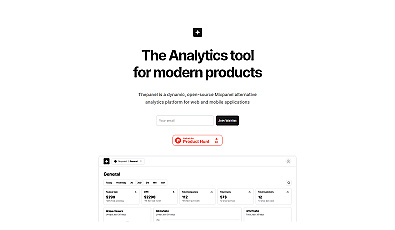
Comprehensive analytics for web and mobile applications.
Efficient management of website user consent and cookies.
Automates incident resolution for complex IT environments.
AI-driven observability for real-time system insights and monitoring.
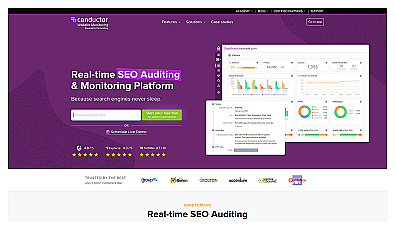
Real-time website monitoring and SEO auditing solution.