Grafana
Visual analytics and monitoring for diverse data sources.
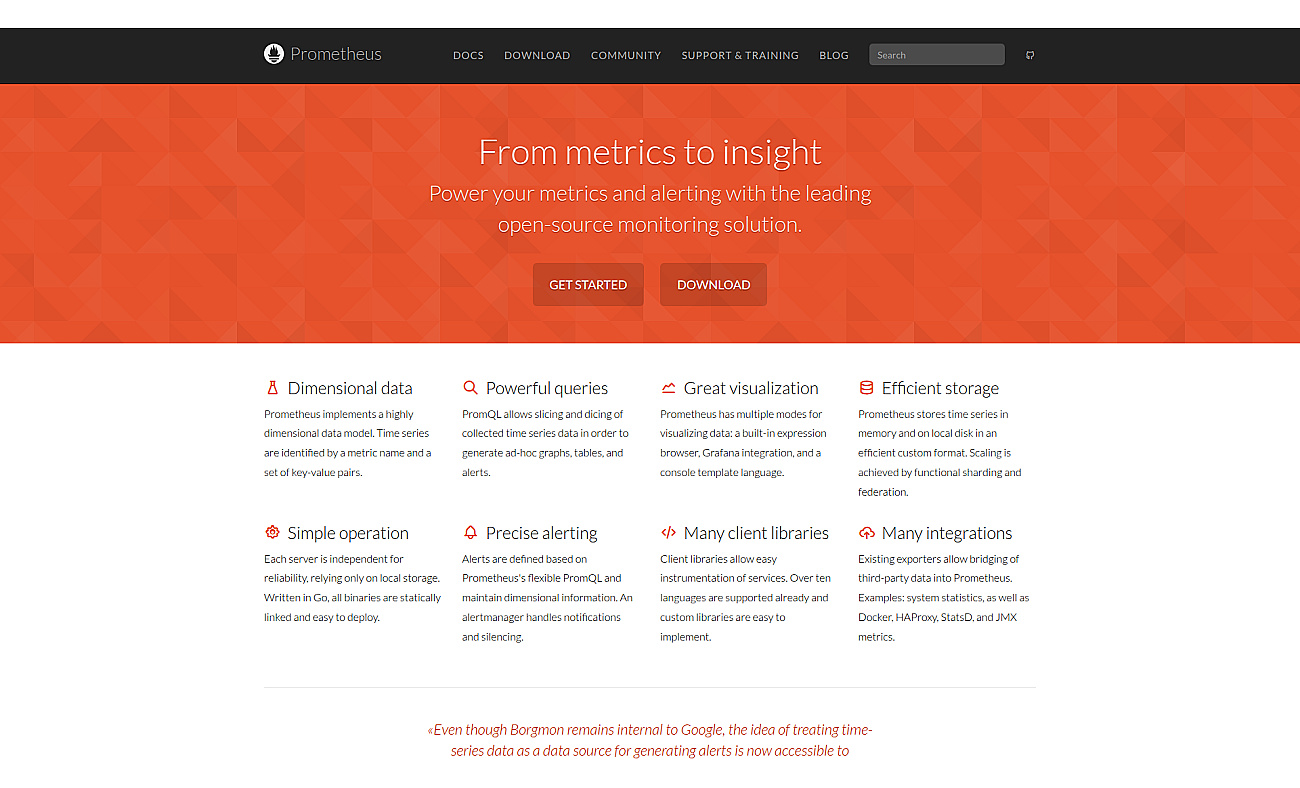
Open-source monitoring solution for system performance and health.
Prometheus is an open-source monitoring system that keeps track of the performance and health of applications and infrastructure. It gathers time series data, allowing users to analyze metrics for better insights.
Users can set alerts based on specific conditions to stay informed about their systems. With a powerful querying language, you can explore data in various ways. Prometheus integrates smoothly with visualization tools like Grafana, which helps in presenting data clearly.
Designed for ease of use, it is a reliable choice for organizations.
Client libraries are available for multiple programming languages, making the integration process straightforward.
Based on overlapping tasks and related categories.
Visual analytics and monitoring for diverse data sources.
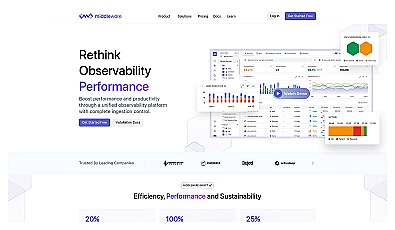
Unified observability for monitoring logs and application performance.
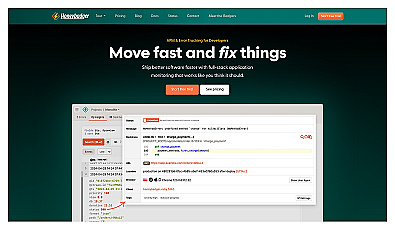
Real-time error tracking and application performance monitoring.
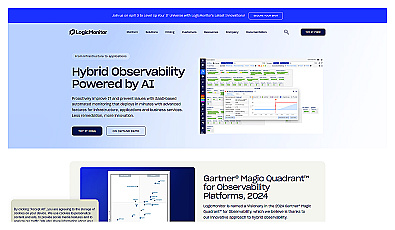
Real-time monitoring for IT infrastructure and applications.
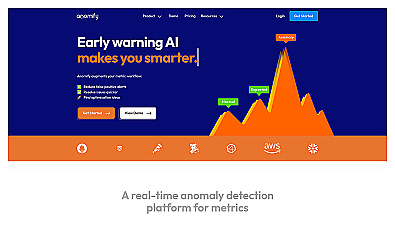
Real-time anomaly detection for operational reliability and performance.
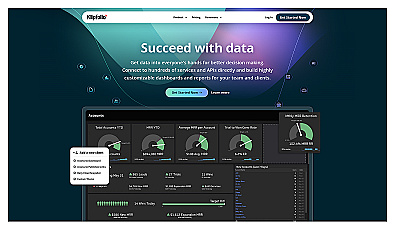
Visualize and report on key business metrics in real-time.
Discover other similar tools and compare features