Grafana
Visual analytics and monitoring for diverse data sources.
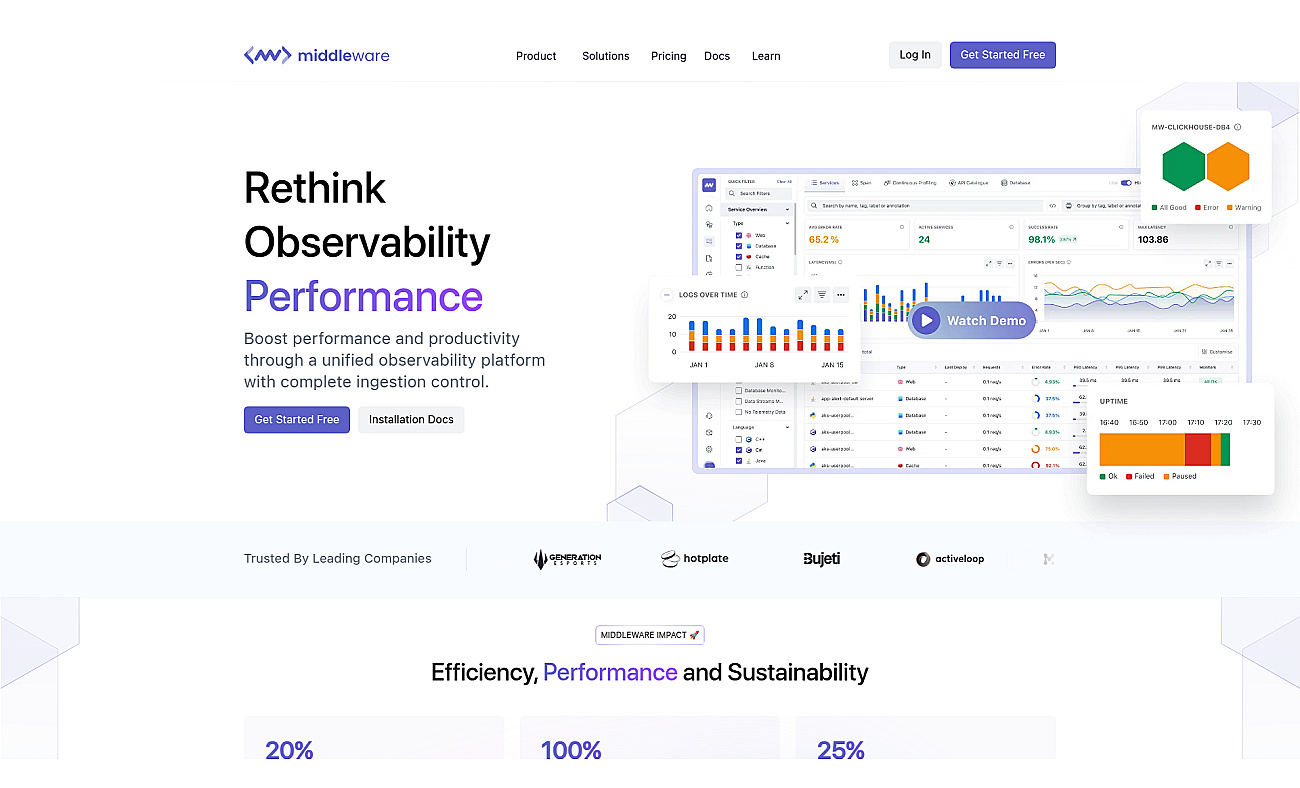
Unified observability for monitoring logs and application performance.
Middleware is a unified observability solution for monitoring logs, databases, and application performance. It allows teams to see everything in one place, making it easier to spot issues quickly.
By providing real-time insights, Middleware enables faster responses to problems as they occur. This approach improves system reliability and boosts the productivity of engineering teams.
Users can track database health, analyze user interactions, and visualize telemetry data for troubleshooting. Middleware integrates seamlessly with various cloud environments and supports synthetic monitoring to ensure uptime. This tool simplifies observability, making it accessible without overwhelming its users.
Based on overlapping tasks and related categories.
Visual analytics and monitoring for diverse data sources.
Real-time error tracking and application performance monitoring.
Open-source monitoring solution for system performance and health.
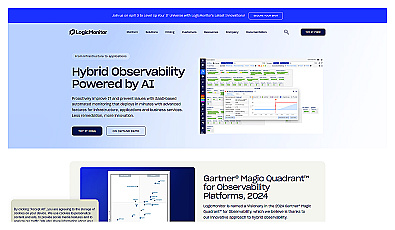
Real-time monitoring for IT infrastructure and applications.
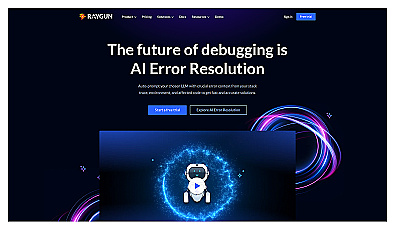
Application performance monitoring and error tracking solution.
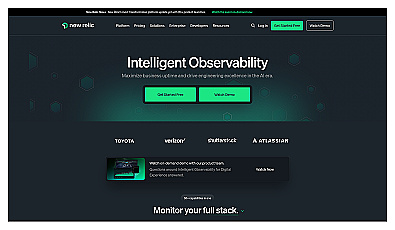
Comprehensive monitoring and analytics for software performance.
Discover other similar tools and compare features