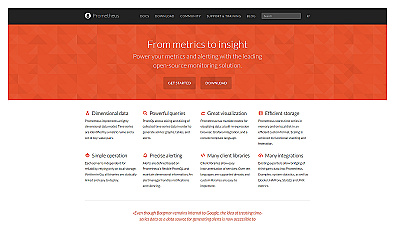
Prometheus
Open-source monitoring solution for system performance and health.
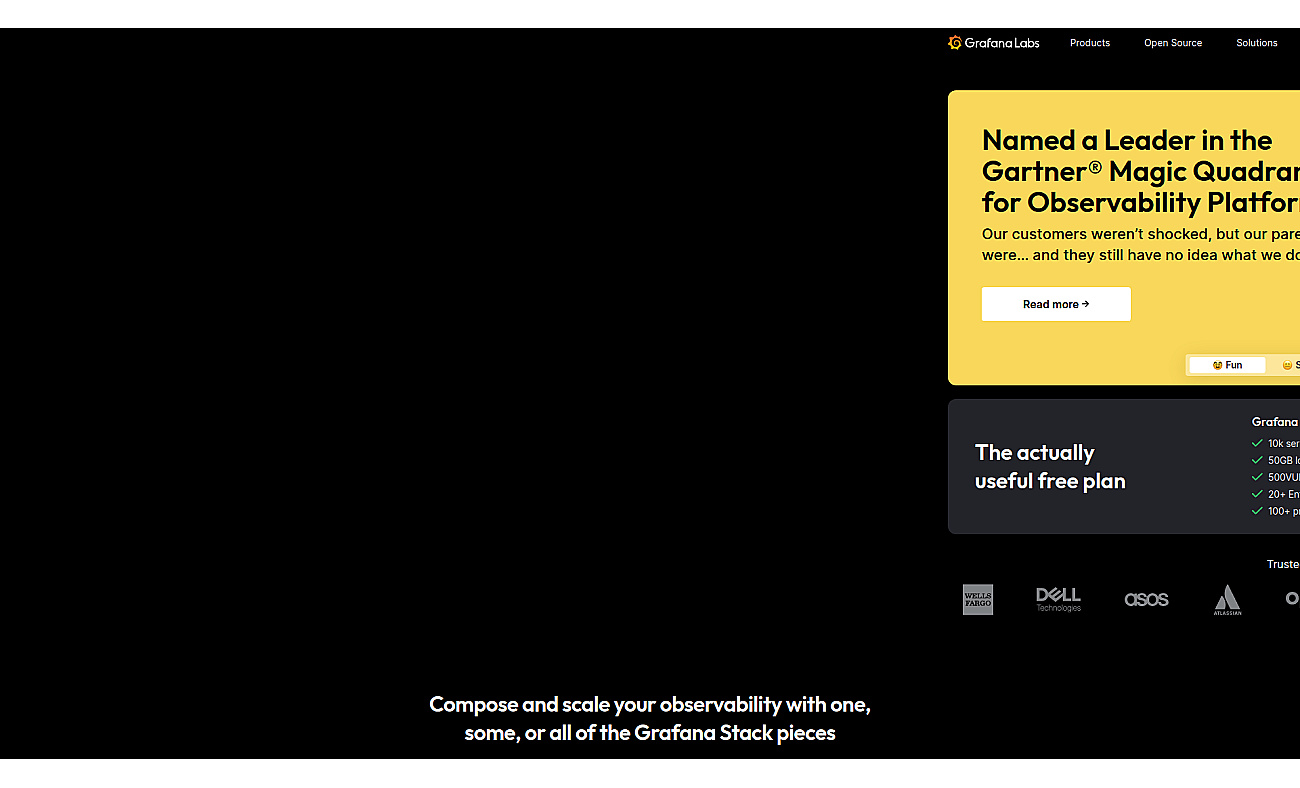
Visual analytics and monitoring for diverse data sources.
Grafana is a robust data visualization and analysis instrument that enables users to create dynamic dashboards from various data sources. By presenting critical metrics in a clear and engaging manner, it aids in understanding system performance and health.
Users can customize their dashboards according to specific needs, enhancing the visibility of operations.
This flexibility allows teams to monitor metrics in real-time, ensuring swift responses to any issues that arise. Grafana's seamless integration with multiple data sources ensures that all necessary information is readily available in one place, making it invaluable for teams aiming to optimize their workflows and reach their objectives efficiently.
Based on overlapping tasks and related categories.
Open-source monitoring solution for system performance and health.
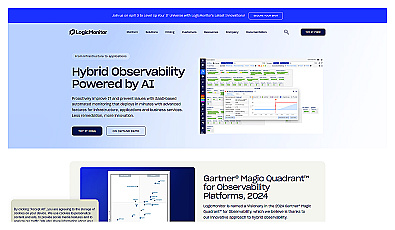
Real-time monitoring for IT infrastructure and applications.
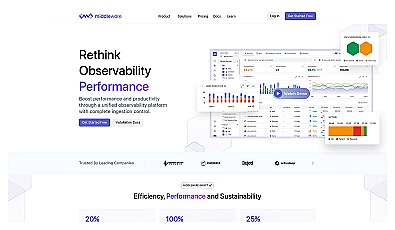
Unified observability for monitoring logs and application performance.
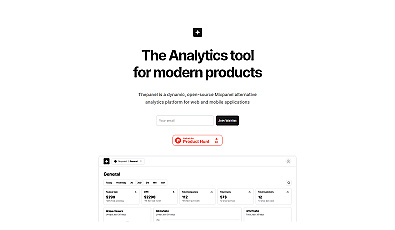
Comprehensive analytics for web and mobile applications.
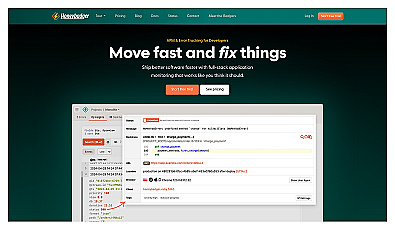
Real-time error tracking and application performance monitoring.
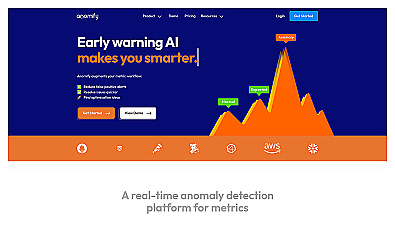
Real-time anomaly detection for operational reliability and performance.
Discover other similar tools and compare features